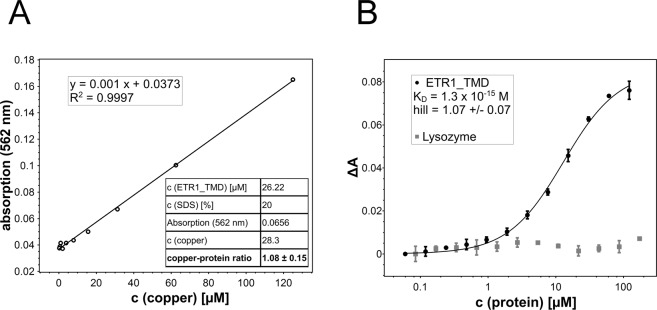
Figure 3.
Copper-binding stoichiometry (A) and binding of copper(I) by the ETR1 transmembrane sensor domain (B). (A) Calibration curve of different BCA2-Cu(I) concentrations used to determine the copper concentration released from the protein (28.3 µM). Stoichiometry of copper-loaded ETR1 was determined by denaturing purified ETR1_TMD (26.22 µM) previously saturated with copper(I) by adding the detergent SDS at 20% (w/v) and heating the sample to 95 °C. The chromophoric copper chelator BCA (2 mM) was added, and absorption at 562 nm monitored. The table shown in the inset summarizes protein and copper concentrations of the experiment corresponding to a copper:protein molar ratio of 1.08:1. (B) Purified ETR1_TMD was titrated to BCA2-Cu(I) complex at concentrations from 122–0.06 µM. Binding of the metal ion was monitored spectrophotometrically by measuring absorbance of the purple BCA2-Cu(I) complex at 562 nm (black points). From the binding curve a dissociation constant KD = 1.3 × 10⁻¹⁵ M and a Hill coefficient h = 1.07 ± 0.07 were calculated for copper binding to ETR1_TMD. The non-copper binding protein lysozyme (grey squares) was used as negative control. All measurements were run in triplicates.

