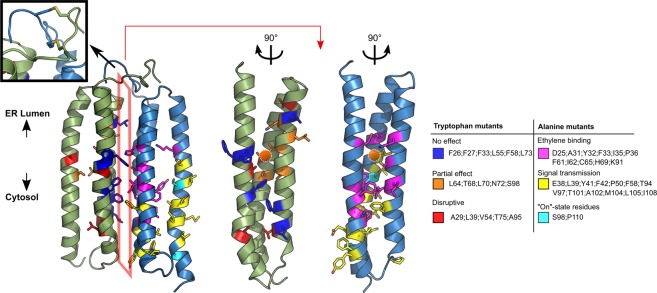
Figure 4.
Dimer model of the ETR1_TMD. On the structure, the positions where tryptophan mutants were generated (left monomer) and where previous loss-of-function mutations were found16 (right monomer) are denoted by the color code on the right, with a list of the residues found in each class. The upper left inset shows the disulfide bridges included during the refinement of the protein. The orange spheres show the putative copper binding site in proximity to residues C65 and H69. The orange polygon indicates the interface. The two structures on the right represent the interface in an “open book” representation. Tryptophan mutants of residues that are pointing towards the monomer bundle core are disruptive (red) or are partially disruptive (orange), while mutations of residues pointing towards the dimer interface of the model (blue) showed no effect on the alpha-helical content, as shown in Fig. 5. Residues that are closer to the protein center and in proximity to the putative copper binding site are essential for ethylene binding (magenta), while residues farther away and closer to the cytosolic portion are responsible for the signal transmission (yellow). Residues shown to be relevant to maintain the protein in an active state are displayed in cyan.

