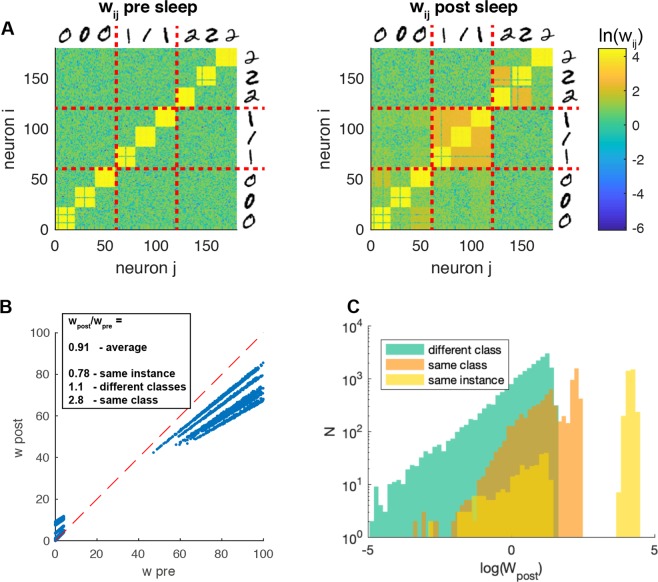
Figure 2.
SO effects on connectivity structure. (A) Synaptic weights matrix of the recurrent connectivity of population, before (left) and after (right) the occurrence of sleep-like activity. The yellow squares represent high weights emerged between neurons encoding the visual input related to the same object (single instance of 0, 1, 2 … image). Red solid lines separate the neurons encoding visual inputs related to different classes of objects (0, 1, 2 …). (B) Scatter-plot of the same synaptic weights before and after sleep. (C) Synaptic weights after sleep, separated in three groups, synapses between neurons encoding the same object (yellow), the same class (but not the same object, orange) and different classes (green).

