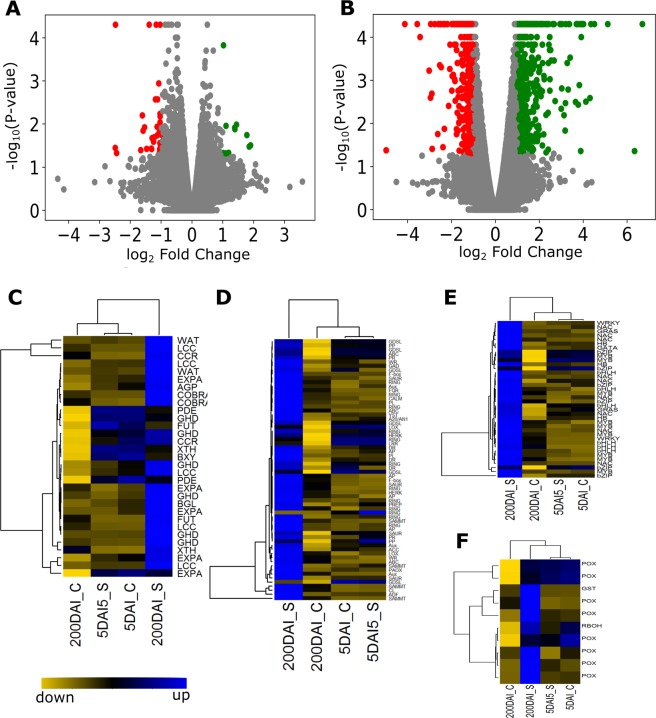
Figure 3.
Isoform-level expression analysis in 5 and 200 DAI samples. (A,B) Volcano plots of differentially expressed isoforms at 5 and 200 DAI, respectively. Green and red dots indicate isoforms significantly upregulated (log2 ≥ 1 and P < 0.05) and downregulated (log2 ≤ -1 and P < 0.05), respectively, during smut infection. Hierarchical clustering and isoform-level expression dynamics of putative genes associated with (C) cell wall modification, (D) defense signaling, (E) transcription factors, and (F) ROS scavenging are represented by heatmaps (blue: upregulated isoforms; yellow: downregulated isoforms). List of the isoforms used in heatmap analysis are provided in Supplementary Data Set 2.

