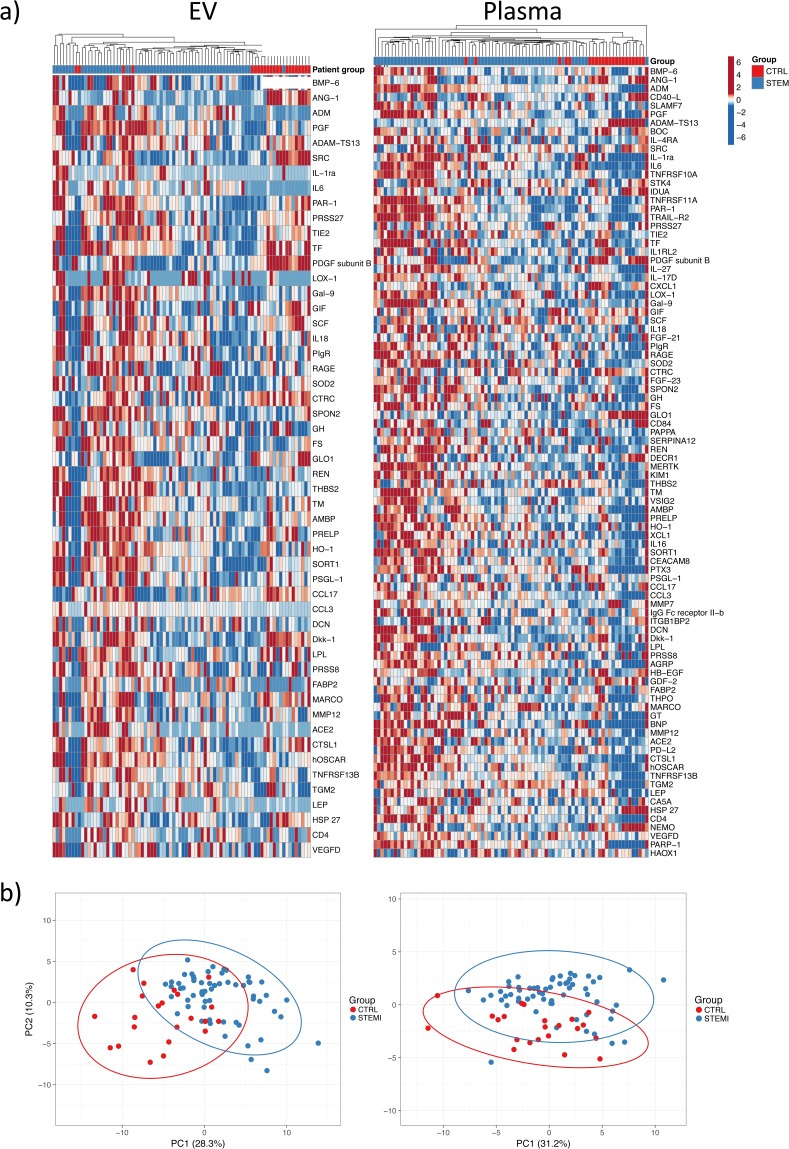
Figure 2.
Proteomic profiling of EV lysates and plasma. (a) Heatmaps of all detected proteins in EV lysates (n = 52) and plasma (n = 92) across all samples. Unit variance scaling is applied to proteins and individuals are clustered using Manhattan distance and average linkage. (b) Principal component analysis based on all proteins detected in EV lysates and plasma. Plots show the first two principal components and their relative contribution to overall variance. Prediction ellipses are such that with a probability 0.95, a new observation from the same group will fall inside the ellipse.

