Figure 6.
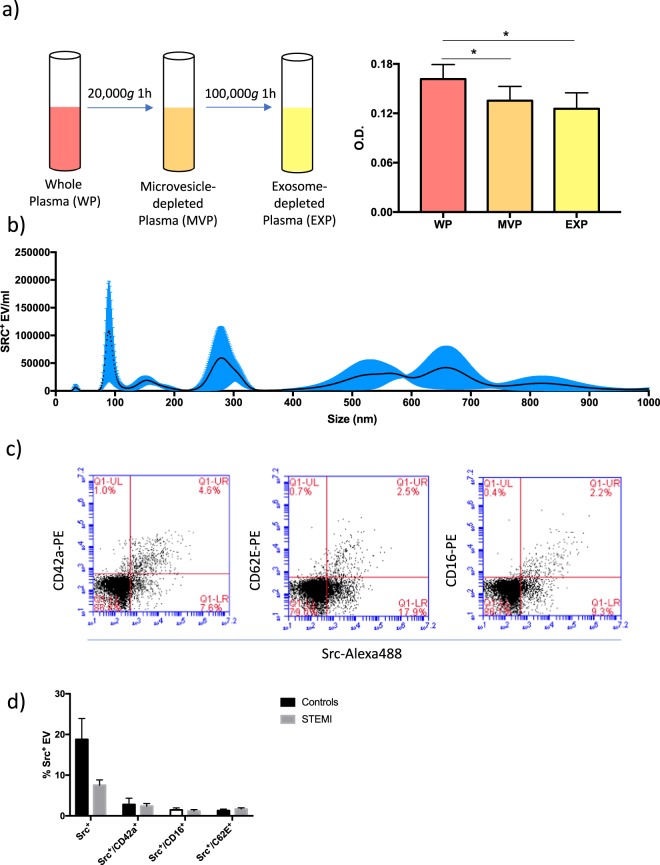
SRC is present on vesicles of different sizes and cellular origins. (a) Depletion of microvesicles and exosomes from normal plasma was obtained by sequential centrifugation at 20,000 × g for 1 h and 100,000 × g for 1 h. SRC was quantified in each plasma fraction using ELISA (n = 5). Repeated measures 1-way ANOVA was used to test the difference between whole plasma and microvesicle- and exosome-free plasma, respectively, *p < 0.05. (b) Nanoparticle tracking analysis was performed on trapped EVs isolated from a healthy individual and stained with a primary SRC antibody and a secondary Alexa488-conjugated antibody. The size distribution of fluorescently labeled EVs was measured. Mean and standard error from 5 repeated measurements are presented. (c) Acoustically trapped vesicles from one healthy control were co-stained with SRC/IgG-Alexa488 antibodies and PE-conjugated antibodies against either CD42a, CD62E or CD16. Gates were set to include particles in the size range 240–800 nm. Representative scatter plots showing the proportion of single- and double positive EVs for each staining are presented. (d) Proportion of SRC+ EV subpopulations in the plasma of healthy individuals and STEMI patients (n = 6 per group). Mean and standard deviation is indicated.

