
Figure 2.
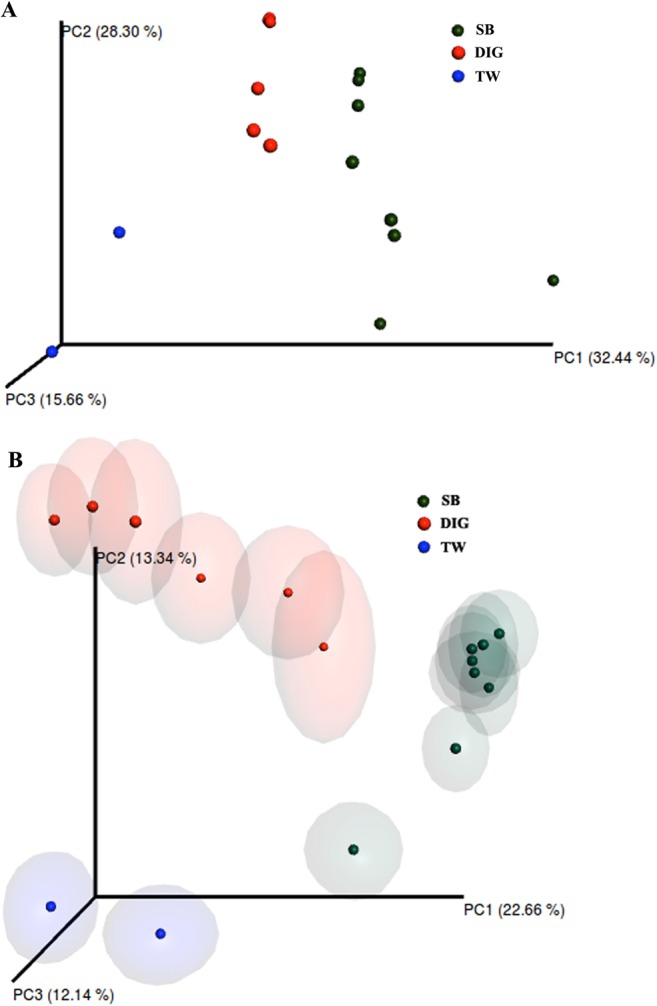
Principal coordinates analysis (PCoA) of the bacterial communities derived from the weighted (A) and unweighted (B) UniFrac distance matrix. Circles represent individual samples from swim bladder microbiota (green circles; n = 8) and distal gut digesta microbiota (red circles; n = 6) from Oncorhynchus mykiss. Blue circles (n = 2) represent microbiota from water samples of experimental tanks; these samples were not included in the beta diversity analysis. The confidence ellipsoids around sample symbols display the degree of variation from one sample to the next.