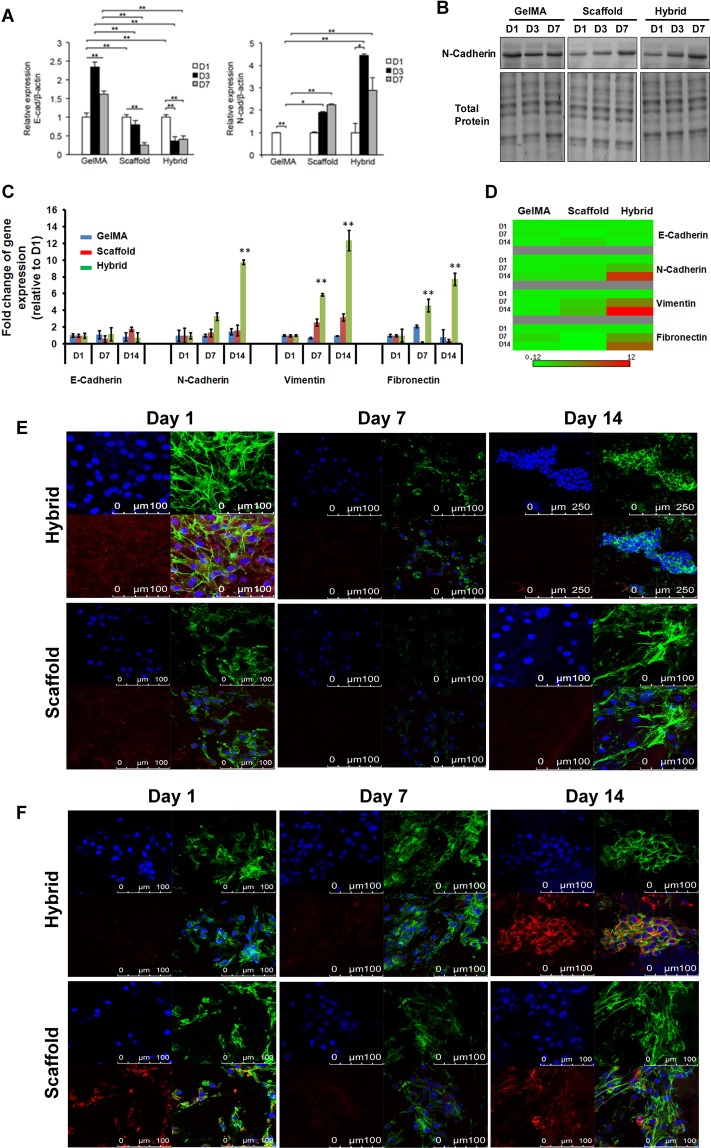
Figure 3.
Relative transcript and protein expression levels of epithelial and mesenchymal markers using MDA-MB-231 and MKN74 cells in GelMA, scaffold and hybrid scaffold. (A) Transcriptional levels of EMT markers E-Cadherin and N-Cadherin were detected by qRT-PCR at Day1, Day3 and Day7 post culturing MKN74 cells. (B) Protein expression level of N-Cadherin of MKN74 cells at indicated time points, showing the up-regulation of N-Cadherin at D7 in hybrid scaffolds. We performed 3-independent experiments. One representative image has been shown here. Uncropped full images for total protein and western blot gels have shown in Supplementary Fig. S8. (C,D) Transcript levels of EMT markers E-Cadherin, N-Cadherin, Vimentin and Fibronectin in MDA-MB-231 cells at Day1, Day7 and Day14. β-actin was utilized to normalize gene expression data. Results were shown as mean ± S.D. (E) Representative confocal microscopic images of MDA-MB-231 cells stained with an epithelial marker, E-Cadherin (red) and Alexa Fluor 488 phalloidin for actin cytoskeleton (green) in scaffold and hybrid scaffold. Dual immunostaining of 3D hybrid scaffold cultured with cells showing aggregations of cells with minimal expression of E-Cadherin. (F) Representative confocal microscopic images of MDA-MB-231 cells stained with a mesenchymal marker, vimentin (red) and Alexa Fluor 488 phalloidin for actin cytoskeleton (green) in scaffold and hybrid scaffold. Dual immunostaining of 3D hybrid scaffolds showing higher expression level of vimentin.

