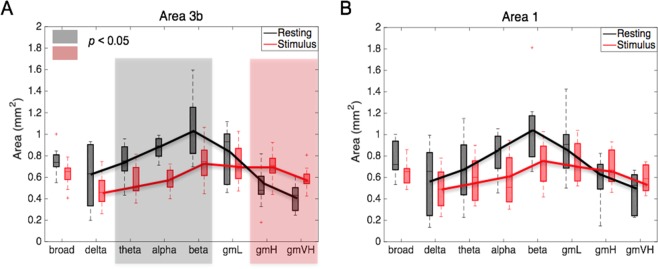
Figure 2.
Comparison of spatial extents of LFP signals in eight frequency bands in areas 3b and 1, between resting state and stimulation. (A,B) The area values of areas 3b and 1, respectively, in both resting (black boxes) and stimulus (red boxes) conditions, significance at p < 0.05. (A) Wilcoxon signed-rank test, as shown in the grey and pink background). A total of 9 runs from three monkeys were analyzed for LFP measurements. Error bars indicate standard deviations.

