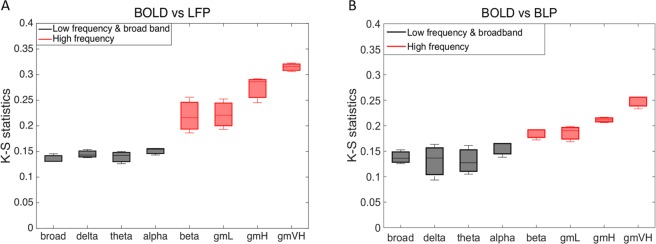
Figure 5.
Group analysis on Kolmogorov-Smirnov statistic between BOLD fMRI correlations and their corresponding monkey’s LFP coherence and band-limited power correlation in eight frequency bands, between areas 3b and 1. (A) Dynamic changes in sliding window correlations in BOLD data were distributed more closely to low frequency LFPs (black, 1–15 Hz) and broad band LFPs (black boxes, 1–150 Hz) coherence, while differed from LFP coherence at high frequency bands (red boxes, 15–150 Hz). (B) Dynamic changes of BOLD functional correlations behaved most similarly to the low frequency BLP correlations (black, 1–15 Hz) when compared to the high frequency BLP correlations (red boxes, 15–150 Hz). A total of 9 runs from three monkeys were analyzed for BOLD, LFP, and BLP measurements, respectively. Error bars indicate standard deviations.

