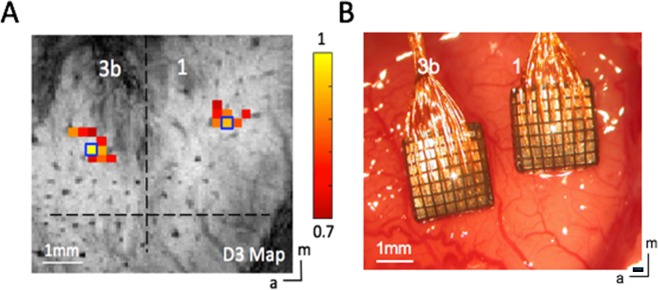
Figure 6.
Stimulus-evoked fMRI activation map (A) Localization of activated digit regions in areas 3b and 1 of one representative squirrel monkey (SM-ZT) in response to vibrotactile stimulation of the D3 tip. Normalized percentage signal change maps were thresholded at 0.7. Dotted black lines indicate the approximate borders between areas 3b and 1, and between digit and face. Blue boxes show the selected seed voxels used in subsequent resting state functional connectivity analysis. (B) Optical image showing blood vessels and the two 7 × 7 multi-channel electrode arrays inserted in the corresponding digit regions of areas 3b and 1 under surgical microscope guidance in the same monkey (SM-ZT). (Scale bar, 1 mm.) a, anterior; m, medial.

