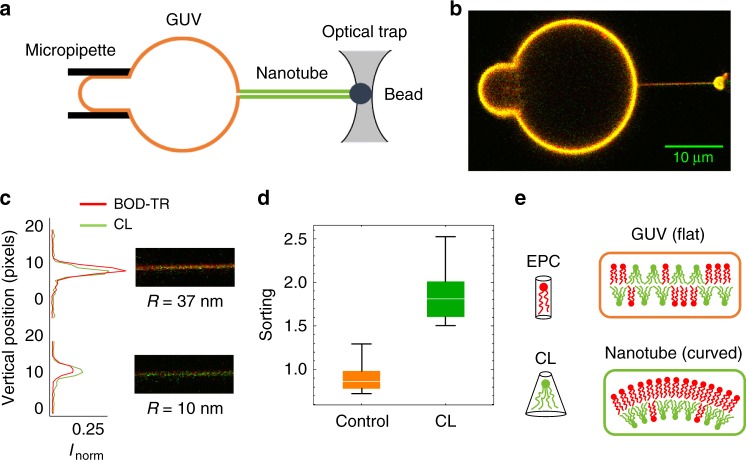
Fig. 1.
CL is enriched in curved membranes. a Schematic of tube assay. A bead in an optical trap is used to pull a membrane tube from a GUV held by a micropipette. The pressure in the micropipette controls the membrane tension and the resulting tube radius. The concentration of the reference lipid and the CL in the tube are measured by confocal fluorescence microscopy. b Confocal image of a tube pulled from a GUV containing CL. The membrane (red) was labelled with a fluorescent reference lipid (Bodipy TR-Ceramide) and the CL (green) with Top-Fluor CL. Contrast has been enhanced, and green and red intensities have been scaled to match in the GUV (which is orange-yellowish). The green color of the tube reflects CL enrichment in the tube (relative to the GUV). c Images and intensity profiles of tubes pulled from GUVs containing CL for large (R ≈ 37 nm) and small (R ≈ 10 nm) tube radii. CL is enriched in curved membranes obtaining higher intensity in the green channel compared to the red channel in small tubes. d Box plots comparing the sorting ratio for curved tubes (c = 0.10 ± 0.03 nm−1) pulled from GUVs containing green fluorescent lipids: control (in orange) and a CL density of 0.10 ± 0.05 molecules per nm2 (in green). The median is represented with a line; the box plot represents the 25th–75th percentiles; and the error bars show the 5th–95th percentile. CL is enriched in the tubes (average sorting ratio 1.9 ± 0.3, N = 10 GUVs) comparing with the lipid control (average sorting ratio 0.9 ± 0.2, N = 21 GUVs). (E) CL molecules bend the membrane in the direction of the imposed curvature (inner monolayer, which drives CL enrichment) whereas bends the membrane against the imposed curvature (outer monolayer, which causes CL depletion)

