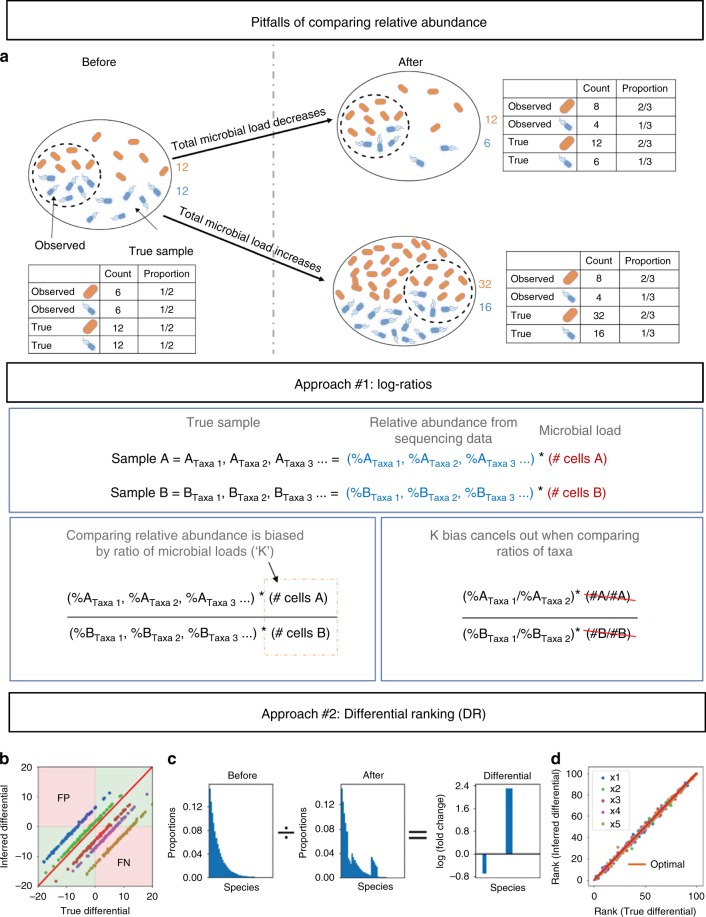
Fig. 1.
Illustration demonstrating statistical limitations inherent in compositional datasets. a Two different biological scenarios can yield the exact same proportions of taxa in samples from a population pre- and post-treatment. b Simulated datasets plotting the true differential obtained using absolute abundance data on the x-axis, versus the inferred differential obtained using relative abundance data on the y-axis. Each dot represents a taxon in the dataset, and the colors represent datasets with various ratios of total microbial load (K) between before and after samples. The red line represents the optimal scenario where the samples have equal microbial load. This illustrates the prevalence of either false positives (FP) or false negatives (FN) when performing differential abundance analysis on samples with unequal total microbial load. The presence of either FPs or FNs is dictated by a nonlinear function of the true differential (see online methods). c An illustration of differential proportions of bacterial species before and after treatment. d Same data as b but plotting the rank of the differentials, demonstrating that ranks are equivalent regardless of differences in microbial load

