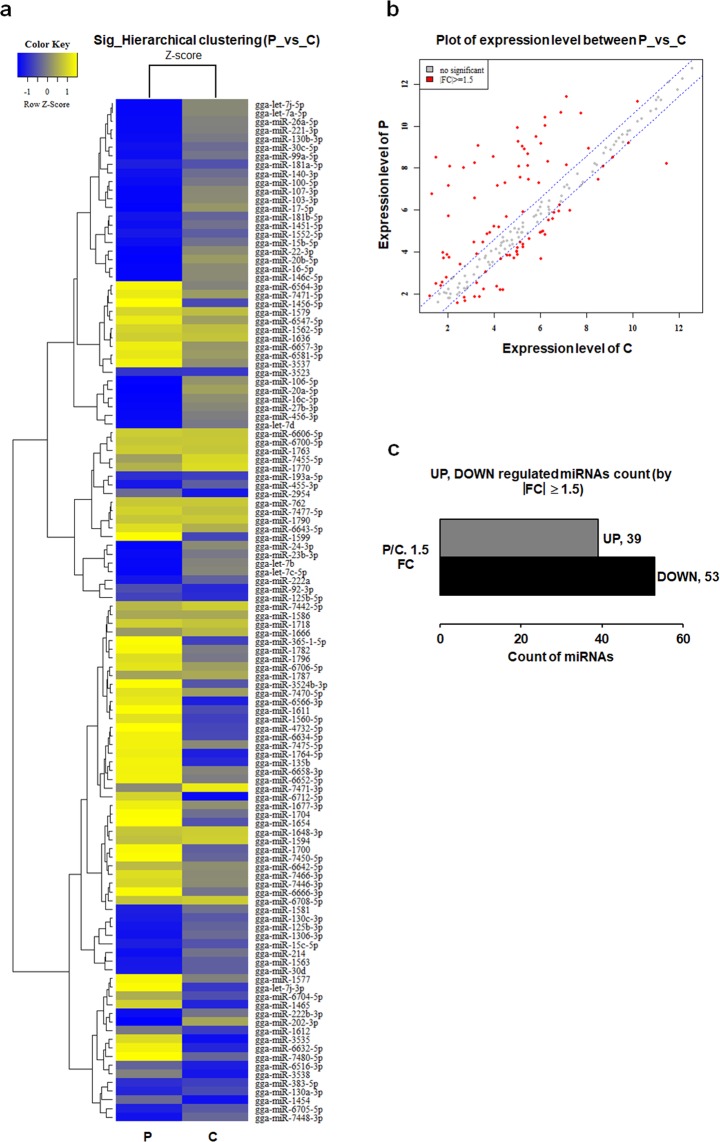
Figure 4.
MicroRNA (miRNA) expression levels in 40-week-old male chicken testis. (a) Hierarchical cluster analysis of miRNA expression levels. Heat map representation of miRNAs that differed significantly between plasma treatment (P) and control (C) groups. Rows represent transcriptional units. miRNAs that share a similar trend of ascending or descending property are clustered. The yellow represents the maximum Z-score; the blue represents the minimum Z-score. (b) Scatter plot of miRNA expression levels. Red dots represent significant miRNAs; grey dots represent no significant miRNAs. (c) Bar plot of significant miRNAs. FC, fold change. miRNA with |FC| ≥ 1.5 and a p-value < 0.05 is significantly up- or down-regulated. The detailed information of significant miRNAs see Supplementary Table S1.

