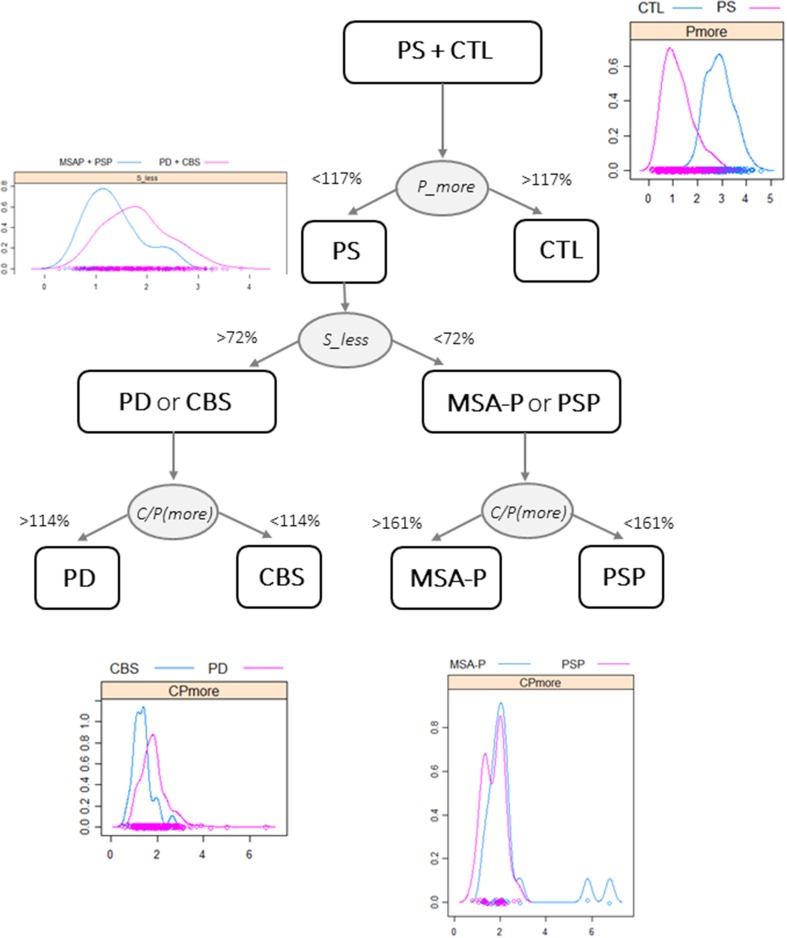
Fig. 4.
A tentative diagnostic flowchart using relevant outcomes [P(more), S(less) uptakes and C/P ratio on the more affected side] from the semiquantitative analysis to separate CTL and the various PS (PD, MSA-P, PSP or CBS) groups according to reference limits expressed as percentages of normal values. Selective density plots are shown at each step

