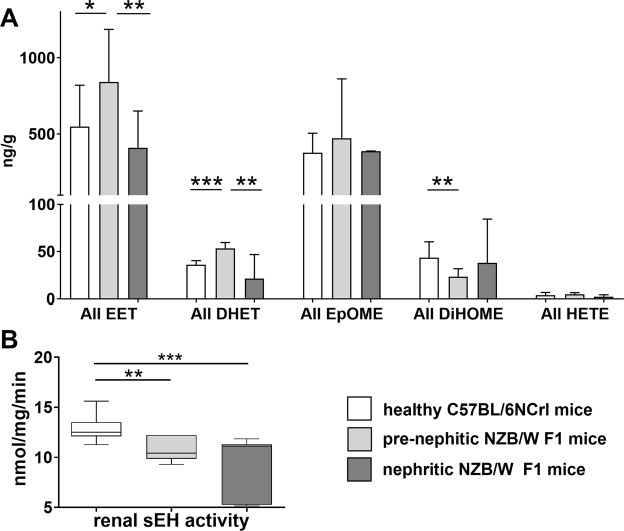
Figure 1.
Renal epoxy fatty acids and metabolites in lupus prone NZB/W F1 and healthy C57BL/6NCRL mice. (A) Comparison of the cumulative renal EET (5,6-; 8,9-; 11,12-; 14,15-EET), EpOME (9,10-; 12,13-EpOME), DHET (5,6-; 8,9-; 11,12-; 14,15-DHET), DiHOME (9,10-; 12,13-DiHOME) and 20-HETE levels between healthy C57BL/6NCRL (n = 7), prenephritic (n = 6) and nephritic NZB/W F1 mice (n = 5). (B) Renal sEH activity in healthy C57BL/6NCRL (n = 12), prenephritic (n = 7) and nephritic NZB/W F1 mice (n = 7). Bars, median; boxplots, median and interquartile range; whiskers, range; white boxplot, healthy C57BL/6NCRL mice; light grey boxplot, prenephritic NZB/W F1 mice; grey boxplot, nephritic NZB/W F1 mice; *p < 0.05; **p < 0.01; ***p < 0.001. Values that passed the Kolmogorov-Smirnov test for Gaussian distribution were compared using the unpaired t test; otherwise, the Mann-Whitney test was applied.

