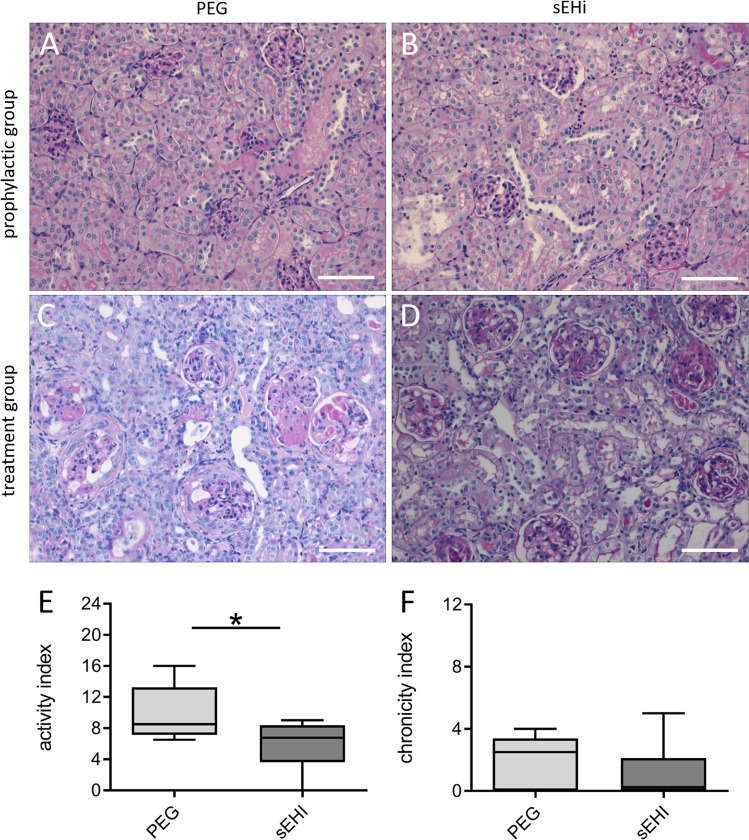
Figure 3.
Impact of therapeutic sEH inhibition on renal histology findings in lupus prone NZB/W F1 mice. Representative kidney histology in the prophylactic group after four weeks of exposure to PEG (A) or sEHI (B; HE staining, 200x magnification). (C) Example histology from the treatment group after three weeks of exposure to PEG. Note the destroyed glomeruli (PAS staining, 200x magnification). (D) Kidney sample after 3-weeks exposure to sEHI, showing less severe glomerular changes than for the PEG group (PAS staining, 200x magnification). Scale bars = 100 µm. Comparison of the activity (E) and chronicity (F) indices of kidneys after three weeks of sEHI (n = 8) and PEG treatment (n = 8) of mice in the therapeutic setting. Boxplots show medians and interquartile ranges; whiskers, range; light grey, PEG treatment; dark grey, sEHI treatment; *p < 0.05. Compared using Mann Whitney test.

