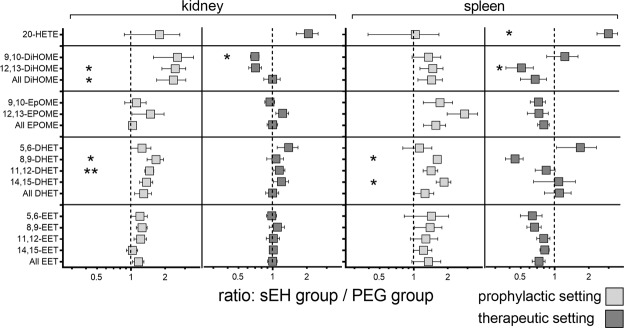
Figure 4.
Comparison of metabolic changes in sEHI- and PEG-treated NZB/W F1 mice in the kidneys and spleen. To visualise changes due to sEH inhibition, the values are displayed as ratios (sEHI group/PEG group); consequently, a ratio >1 indicates an increased amount of that metabolite, while a ratio <1 indicates a decreased amount, compared to the PEG group. Significant differences between groups are measured by Mann Whitney test and are indicated by asterisks. Light grey, prophylactic setting (4 weeks sEHI exposure before onset of proteinuria); dark grey, therapeutic setting (3 weeks sEHI exposure after onset of proteinuria); *p < 0.05; **p < 0.01.

