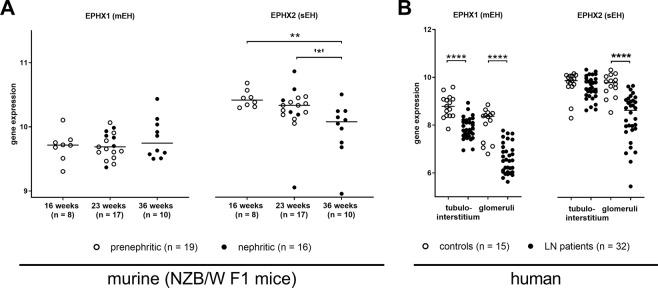
Figure 6.
Renal mEH (EPHX1) and sEH (EPHX2) gene expression in NZB/W F1 mice and human LN patients and controls. (A) Renal EPHX gene expression in NZB/W F1 mice with increasing age and disease. Bars, median; every circle represents one value; filled circles, nephritic mice; open circles, prenephritic mice, *p < 0.05 (when comparing n = 11 prenephritic 23 week old mice with n = 10 nephritic 36 week old mice), **p < 0.01. (B) Comparison of renal EPHX expression in the tubulointerstitium and glomeruli of 32 patients with acute LN and 15 healthy pre-transplant donors. Bars, median; every circle represents one patient/value; filled circles, LN patients; open circles, controls; ****p < 0.0001. Values that passed the Kolmogorov-Smirnov test for Gaussian distribution were compared using the unpaired t test; otherwise, the Mann-Whitney test was applied.

