Figure 2.
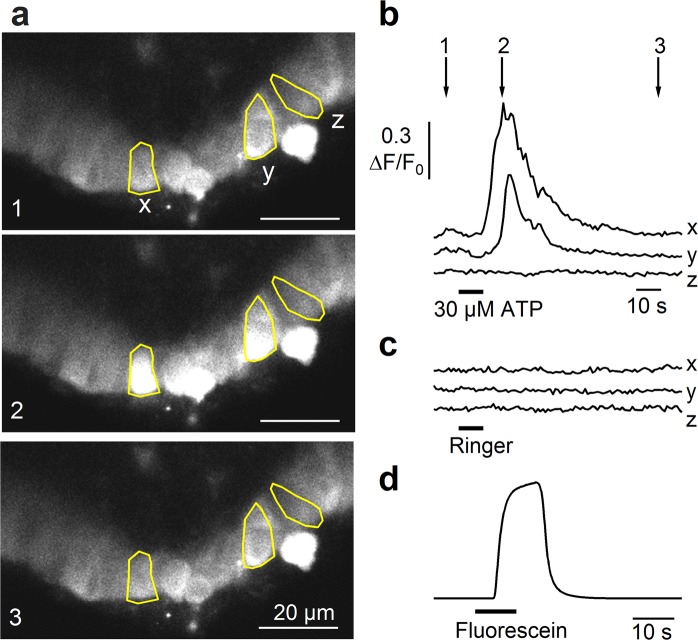
Responses of tracheal epithelial cells to ATP. (a) Representative sequences of confocal images from Cal520-AM loaded tracheal slice before (1), at the peak (2), and after (3) the response activated by 30 μM ATP for 10 s. (b) Calcium transients recorded in the cells highlighted in panel a. Time points indicated by arrows correspond to frame numbers in a. (c) In the same cells, the application of Ringer’s solution did not evoke significant calcium signals. (d) Fluorescence evoked by application of fluorescein was used to measure the rate of perfusion system.

