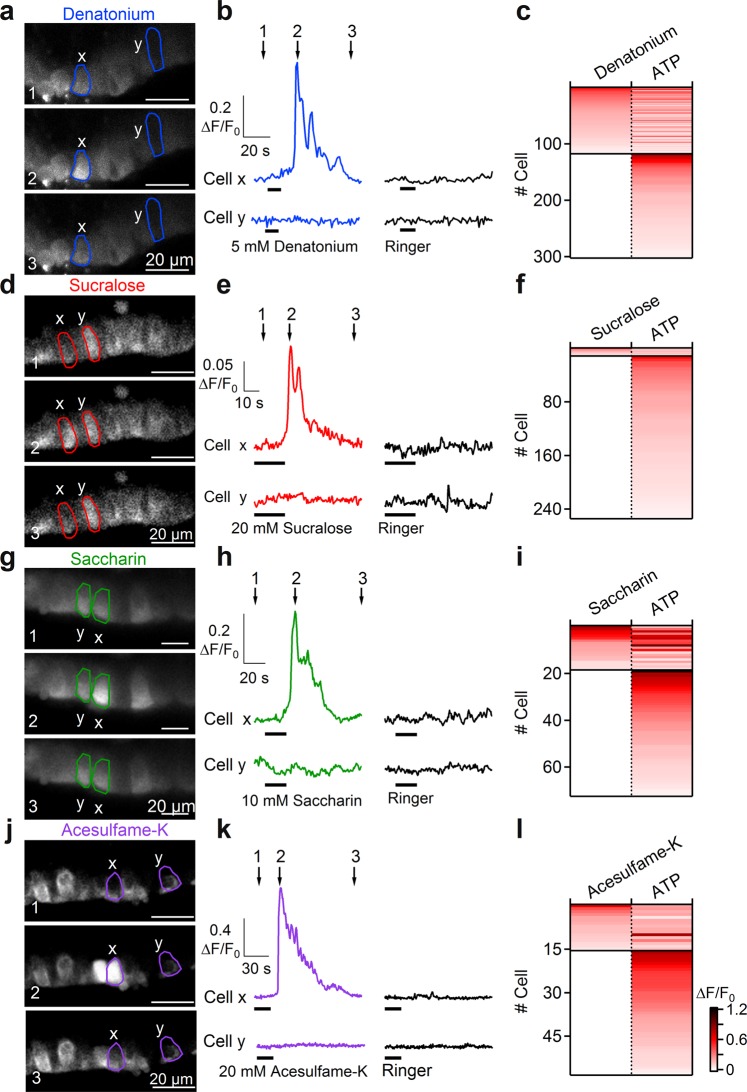
Figure 3.
Tracheal epithelial cells respond to bitter tastants and artificial sweeteners. (a–d–g–j) Representative sequences of confocal images from Cal520-AM loaded tracheal slices before the response (1), at the peak of calcium response activated by 5 mM denatonium, 20 mM sucralose, 10 mM saccharin or 20 mM acesulfame-K (2), and after the response (3). (b–e–h–k) Calcium transients recorded in individual cells (highlighted in a–d–g–j) responding to the indicated stimuli. Time points indicated by arrows correspond to frame numbers in a. (c–f–i–l) Heat maps of normalized change in fluorescence intensity following stimulation with the indicated compounds. Thin black lines indicate divisions among cells with different response profiles.

