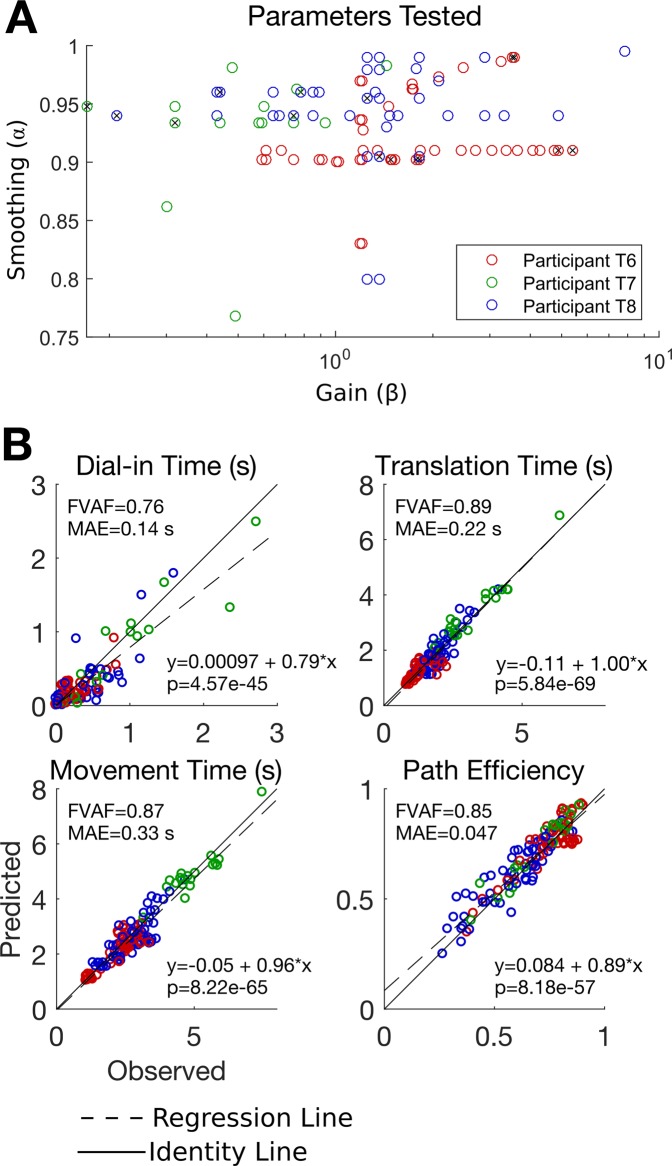
Figure 5.
Assessing the ability of the PLM to predict online performance as a function of gain and smoothing across all 134 blocks included in the study. (A) The gain and smoothing settings imposed for each block are plotted as a circle. Blocks used to fit the model parameters are indicated with a black “x” inside the circle. (B) Observed vs. predicted online performance quantified using four movement performance metrics. Each circle represents the average performance for one block. Model predictions are a good quantitative match to the observed online performance (dots lie close to the solid unity line). In the top left corner of each panel, the fraction of variance accounted for by the model’s predictions (FVAF) is shown in addition to the mean absolute error of the predictions (MAE). To assess the model’s bias and statistical significance, a linear regression was performed for each panel that regressed the model’s predictions against the observed data. The regression coefficients are shown in the bottom right corner and indicate low bias (the slopes are near one and the intercepts are near zero). The regression line is plotted as a dashed black line and the unity line as a solid black line for comparison. Finally, the p-value for the slope coefficient is reported; the slope coefficients are statistically significant for all performance metrics (p < 1e-45 for all metrics), indicating that the model has statistically significant predictive power.

