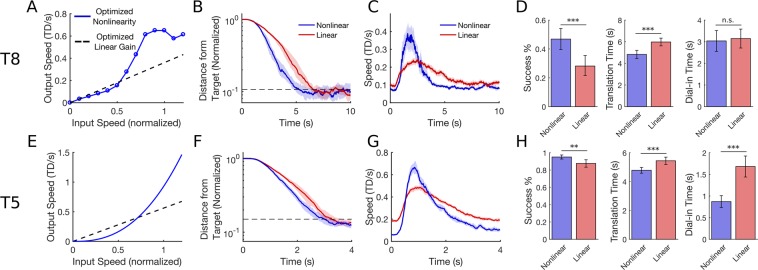
Figure 8.
The PLM finds parameters for a nonlinear speed transform function that improve performance relative to an optimized linear decoder. Results from T8 are shown on the top row and results from T5 on the bottom. (A) The optimal nonlinearity found by the PLM keep low speeds low but scale up higher speeds significantly, enabling both precise stopping and quick movements to the target. (B) Median distance from the target as a function of time when using either the standard Kalman filter (red) or the Kalman filter with the nonlinear speed transform (blue). The added nonlinearity enables the user to reach the target more quickly while maintaining a similar stopping ability (the blue line crosses the target boundary first but levels off to the same steady-state distance as the red line). Shaded regions indicate 95% confidence intervals. Movements were pooled across two sessions. (C) Median cursor speed as a function of time. The nonlinearity improves performance by enabling faster speeds while traveling to the target without causing speeds to be faster when near the target. (D) Mean success %, translation time, and dial-in time with 95% confidence intervals. Three asterisks (***) indicate a significant difference with p < 0.001 and two asterisks (**) indicate p < 0.01 (as computed with a t-test for translation time and dial-in time and fisher’s exact test for success %). (E–H) Same as (A–D) but for participant T5.

