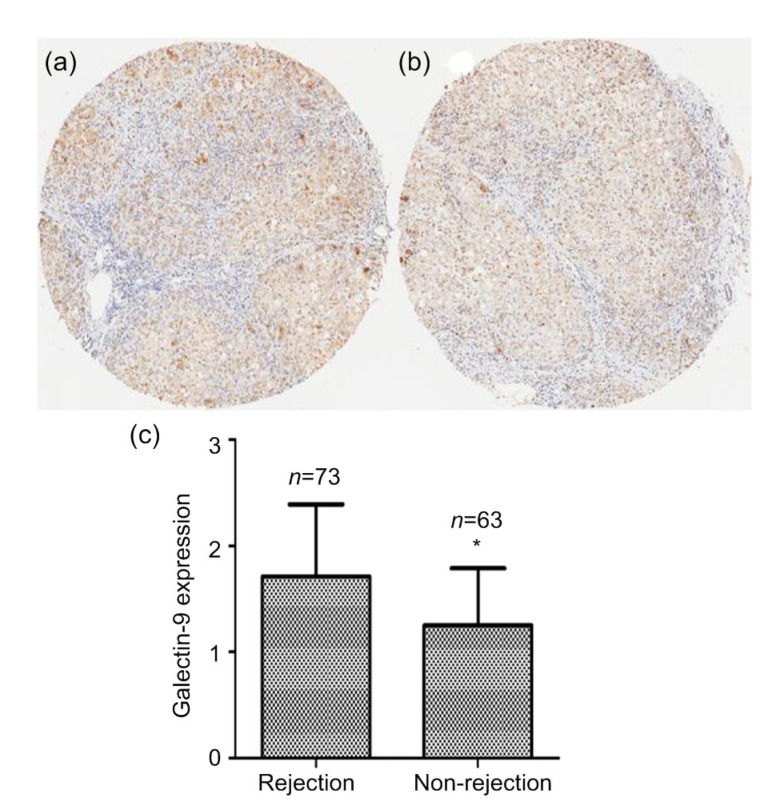
Fig. 3.
Galectin-9 expression in resected livers
(a) Typical immunohistochemistry result from the rejection group. (b) Typical immunohistochemistry result from the non-rejection group. (c) Comparison of galectin-9 expression scores in the two groups. The data are expressed as mean±SD. * P<0.05, vs. rejection group

