Figure 3.

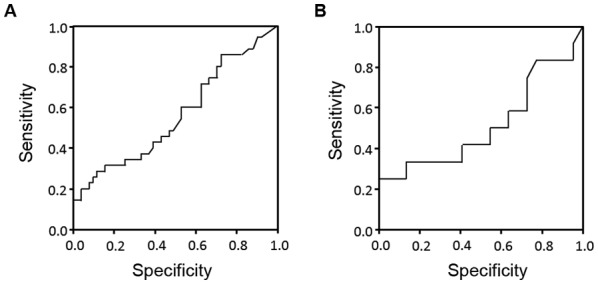
Receiver Operator Characteristic curves for serum carbohydrate antigen 19-9 levels in the (A) NAC group and the (B) Control group. The areas under the curves were 0.63 for the NAC group and 0.51 for the Control group, respectively.

Receiver Operator Characteristic curves for serum carbohydrate antigen 19-9 levels in the (A) NAC group and the (B) Control group. The areas under the curves were 0.63 for the NAC group and 0.51 for the Control group, respectively.