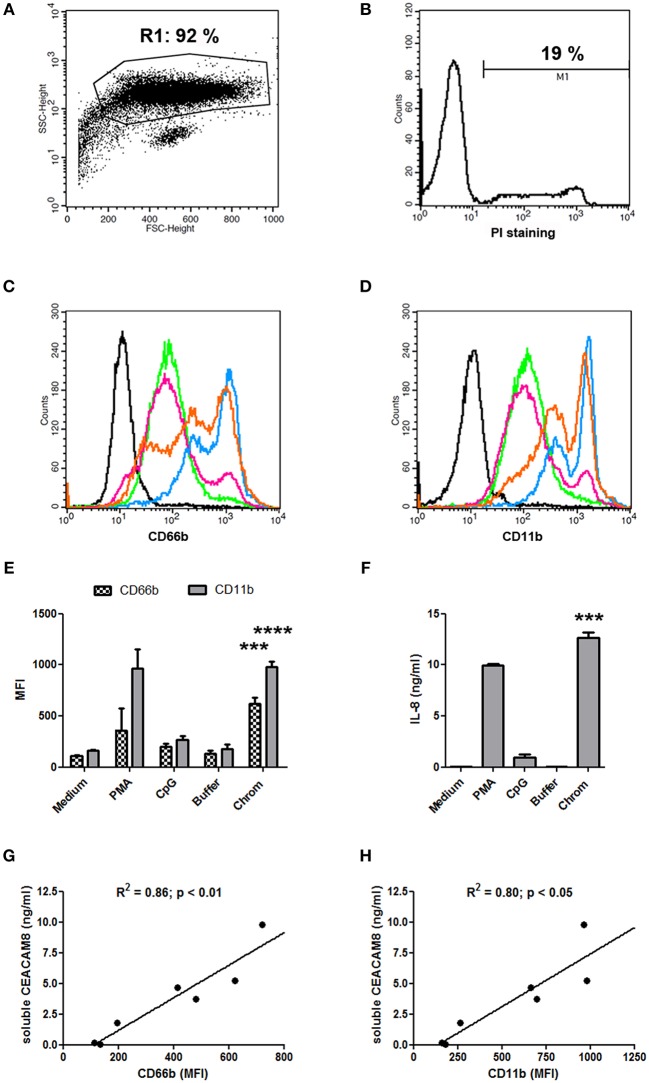
Figure 2.
Chromatin-induced soluble CEACAM8 secretion is associated with PMN activation. (A,B) Classical PMN shape (A) after 14 h of cell culture in medium only (non-activated PMN) and percentage of dead cells (B). PMN were analyzed by flow cytometry after staining with propidium iodide (PI). Size (FSC) and granularity (SSC) are depicted. Numbers represent percentages of gated cells and dead (PI-positive) PMN. (C–F) After 14 h, cell activation was estimated by flow cytometry (C–E) or ELISA (F) with PMN from Figure 1C. (C,D) Representative plasma membrane CD66b (CEACAM8) (C) and plasma membrane CD11b (D) expressions after chromatin activation are represented. Black histogram, PMN in medium stained with isotype control. All other histograms represent PMN stained with CD66b- or CD11b-specific mAb; green, PMN in medium; pink, PMN with chromatin purification buffer; orange, PMN with 1 μg/ml chromatin; blue, PMN with 4 μg/ml chromatin. (E) CD66b (CEACAM8) and CD11b expression levels for all stimuli are summarized (chromatin, 4 μg/ml). MFI, mean fluorescence intensity. (F) IL-8 secretion was quantified (chromatin, 4 μg/ml). (G,H) Correlations between concentrations of secreted soluble CEACAM8 and levels of plasma membrane CD66b (CEACAM8) (G) and CD11b (H) expression by activated PMN were determined using two-tailed Spearman tests. Shown is one representative experiment of seven independent experiments using different donors and different chromatin preparations. Mean and SD of triplicates are shown. ***p < 0.001; ****p < 0.0001 for PMN cultured with chromatin vs. the purification buffer.

