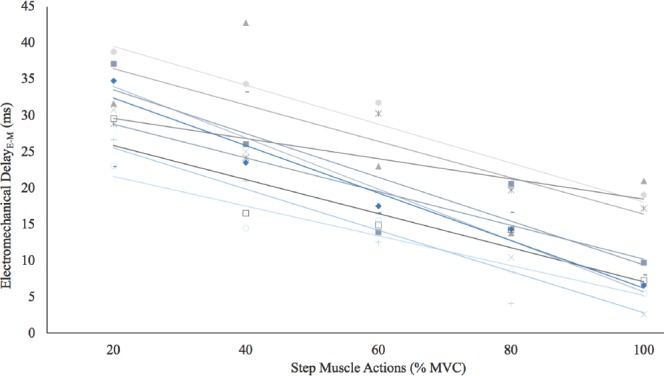
Figure 3.

Individual responses for the electromechanical delay from the onset of the electromyographic signal to the onset of the mechanomyographic signal. There were decreases (r2=0.61 to 0.96; p<0.01) in the duration for the electromechanical delay with each increase in intensity (20>40>60>80>100% maximal voluntary isometric contraction [MVC]) for all subjects.
