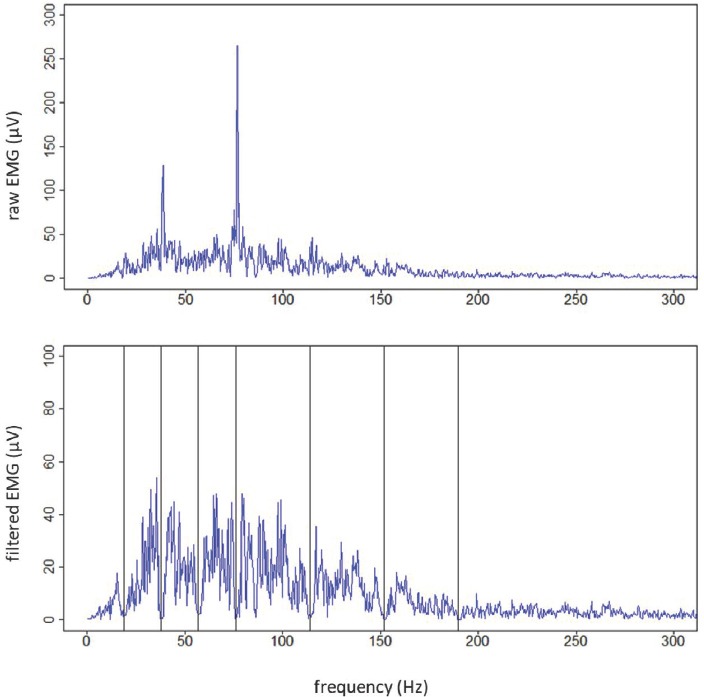
Figure 1.

The frequency domain (FFT) of the EMG signal during a squat cycle. The upper graph shows the raw EMG signal - without filter -, the lower graph shows the filtered EMG signal with vertical lines indicating the mid frequencies of the bandwidth filters.
