Figure 4.

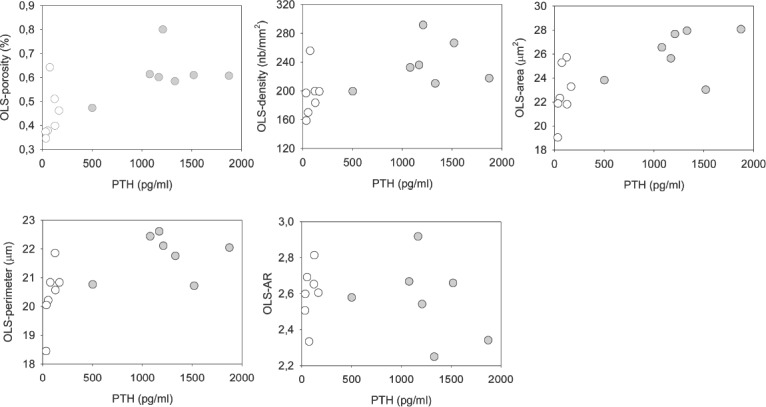
Relationships between OLS parameters and PTH. Grey indicates high turnover, white low turnover patients (for correlation coefficient and p-values see Table 4).

Relationships between OLS parameters and PTH. Grey indicates high turnover, white low turnover patients (for correlation coefficient and p-values see Table 4).