Figure 3.

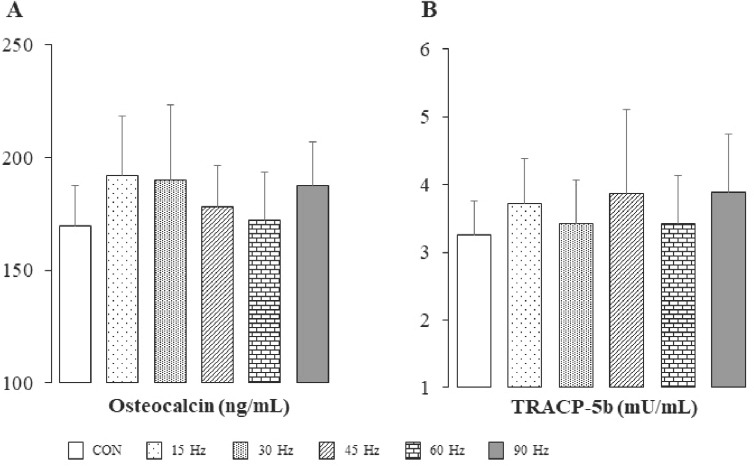
Serum levels of osteocalcin (A) and tartrate-resistant acid phosphatase-5b (B) in all groups. Bar=SD. Sample no.=6. Effect sizes; OC, 0.15; TRACP-5b, 0.10. TRACP-5b, tartrate-resistant acid phosphatase-5b.

Serum levels of osteocalcin (A) and tartrate-resistant acid phosphatase-5b (B) in all groups. Bar=SD. Sample no.=6. Effect sizes; OC, 0.15; TRACP-5b, 0.10. TRACP-5b, tartrate-resistant acid phosphatase-5b.