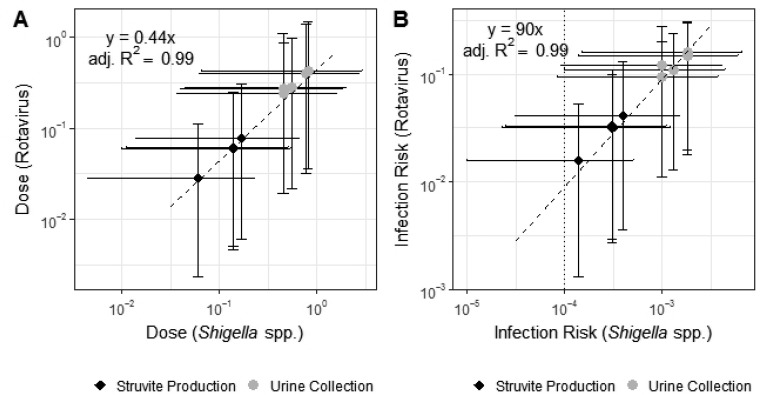
Figure 4.
Linear correlation between (Y-axis) rotavirus and (X-axis) Shigella spp. for simulated hand-to-mouth contacts for (A) dose and (B) infection risk during (black diamond) struvite production and (gray dot) urine collection. Each point represents the median instantaneous dose modeled for each study participant. Horizontal and vertical error bars represent the 95% confidence intervals of the modeled doses. Infection risk is higher than (dotted line) U.S. EPA tolerable disease burden of 10–4 infections per person per year for both rotavirus and Shigella spp.

