Figure 3.
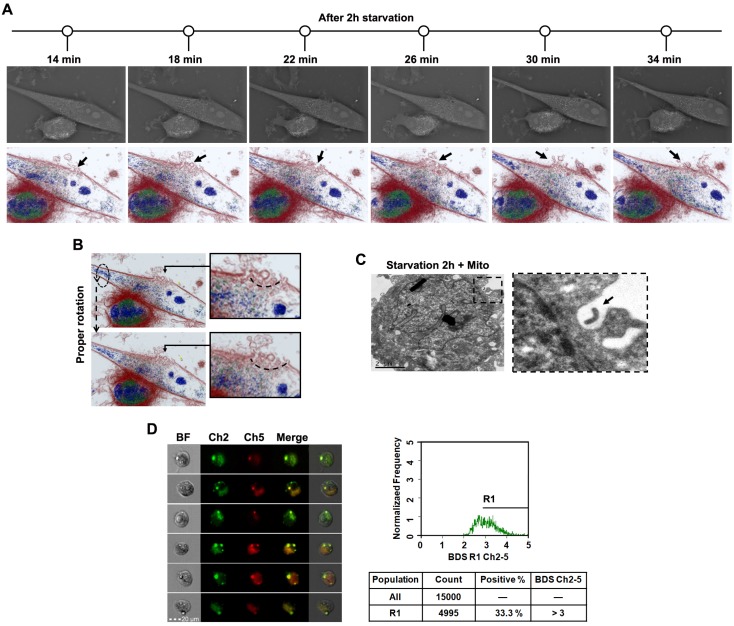
Transplantation of isolated mitochondria into U87 cell through endocytosis. (A) After 2h starvation, the whole process of endocytosis was captured with a time lapse 3D tomographic microscope. Cell morphology, colored by the individual refractive indexes of each component, is clearly visible. Black arrow: plasma membrane invagination. (B) Endocytosis was observed after proper rotation of the stereoscopic structure of U87 cells. Arc line: endocytosis structure. (C) TEM of mitochondrial interaction with endocytosis. Black dashed box: endocytic region; black arrow: exogenous mitochondria. Scale bar: 2 μm. (D) The multispectral imaging flow cytometry was used to measure the intracellular colocalization of isolated mitochondria (MitoTracker Red labeling) with the endosomes (stained with pHrodo). Ch2: pHrodo; Ch5: MitoTracker Red; BF: brightfield; BDS Ch2-5: bright detail similarity Ch2-Ch5.

