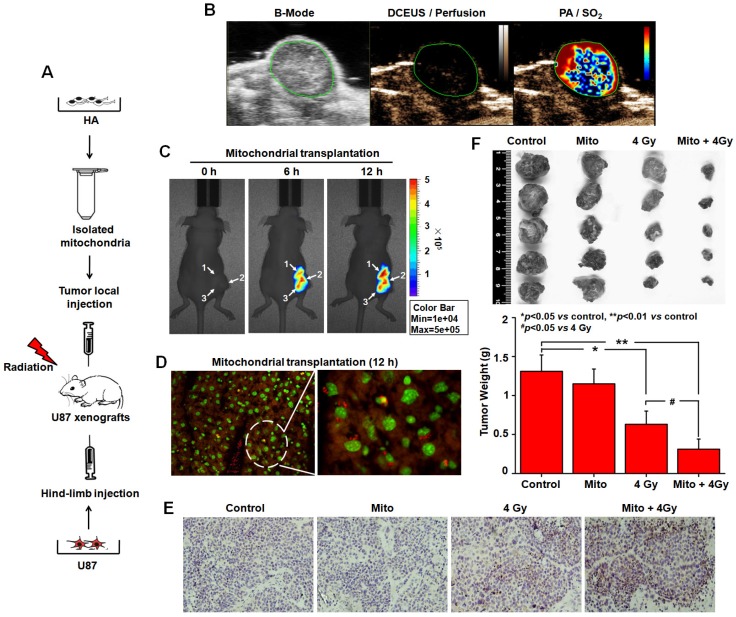
Figure 7.
Radiosensitization by mitochondrial transplantation in vivo. (A) Experimental schematic to test radiosensitizing effect of mitochondrial transplantation in U87 xenograft tumors. (B) Spatial patterns of blood perfusion and oxygen saturation in xenograft tumors. (C) At 6 h and 12 h after injection, the distribution of isolated mitochondria in xenograft tumors was detected by In-Vivo Xtreme II optical imaging system. White arrow: three-point injection. (D) The localization of isolated mitochondria in xenograft tumors was observed using tissue sections. Red: isolated mitochondria; Green: nuclei. (E) Apoptosis in xenograft tumors was measured by TUNEL-stained histology of tissue sections. Brown: TUNEL-positive cells. (F) Tumors were excised and weighed at the end of the experiment. *p<0.05, **p<0.01 vs. control group; #p<0.05 vs. 4 Gy irradiation alone.

