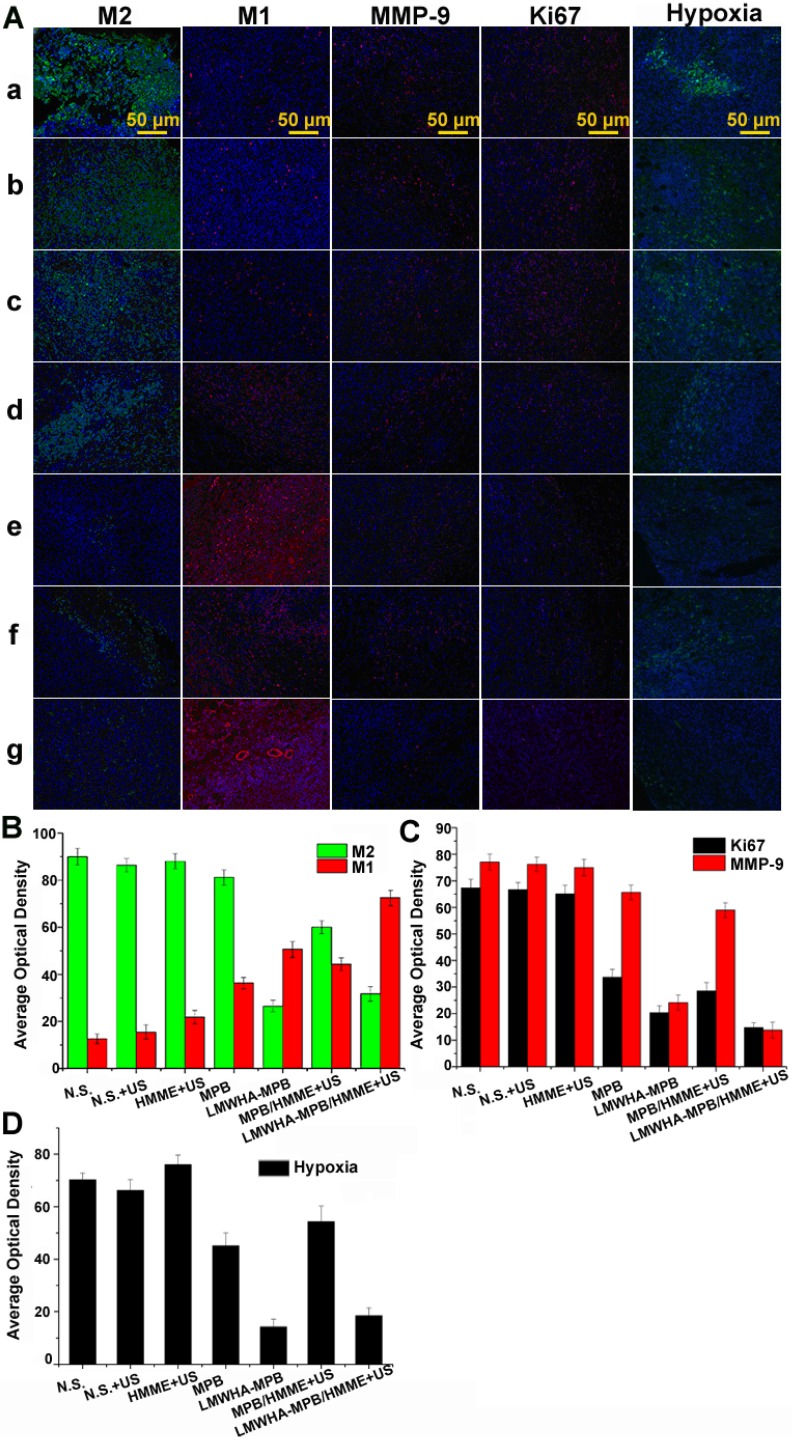
Figure 7.
(A) Representative immunofluorescense images of tumor slices stained by CD206 (M2), CD86 (M1), MMP-9, Ki67 and Hypoxia maker, respectively. (a: N.S.; b: N.S.+US; c: HMME+US; d: MPB; e: LMWHA-MPB; f: MPB/HMME+US; g: LMWHA-MPB/HMME+US). (B) The quantitative AOD values of M1 and M2 in histogram. (C) The quantitative AOD values of Ki67 and MMP-9 in histogram. (D) The quantitative AOD values of hypoxia marker in histogram.

