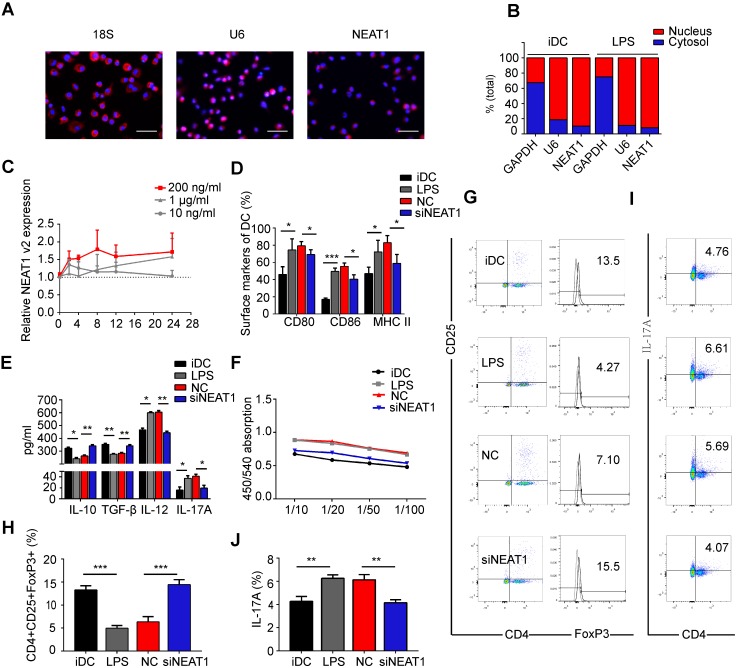
Figure 1.
Knockdown of NEAT1 induces tolerogenic phenotype in dendritic cells (DCs). (A) DCs were stimulated with LPS (200 ng/ml) and labeled using FISH; 18S served as cytoplasmic control transcript, and U6 served as nuclear control transcript. 18S (red), U6 (red), NEAT1 (red), and nuclei stained with DAPI (blue) are shown. Scale bars correspond to 50 µm. (B) After RNA was separated into the nuclear and cytosolic fractions, RNA expression levels were measured by qRT-PCR. GAPDH was used as cytosolic marker, and U6 was used as nuclear marker. (C) DCs were stimulated with lipopolysaccharide (LPS; 10 ng/ml, 200 ng/ml, or 1 µg/ml). NEAT1 v2 expression was determined by qRT-PCR at different time points (0, 4, 8, 12, and 24 h). (D,E) DCs were transfected with NEAT1 smart silencer (siNEAT1) or negative control (NC) for 12 h before treatment with LPS (200 ng/ml). The co-stimulators (CD80, CD86, and MHC II) were detected by flow cytometry (D). Cytokine levels (IL10, TGF-β, IL12, and IL-17A) were analyzed by ELISA in DC supernatants (E). Data are expressed as mean ± SD; n = 4 biological replicates; *p<0.05, **p<0.01, ***p<0.001, derived by Student's t-test. (F-J) DCs were transfected with NEAT1 smart silencer (siNEAT1) or NC for 12 h, then treated with 200 ng/ml LPS (12 h) and 10 μg/ml mitomycin C (2 h). These DCs were cocultured with allogeneic T cells for 48 h. T-cell proliferation was assessed by BrdU ELISA at the ratios of 1:10, 1:20, 1:50, and 1:100 (DC/T cells) (F). The numbers of CD4+CD25+FoxP3+Tregs were assessed by flow cytometry (G). The percentage of Tregs is shown in (H). The numbers of TH17 (CD4+ and IL-17A+) cells were assessed by flow cytometry (I). The percentage of TH17 is shown in (J). Data are expressed as mean ± SD; n = 3 biological replicates; **p<0.01, ***p<0.001, derived by Student's t-test.

