Figure 6.
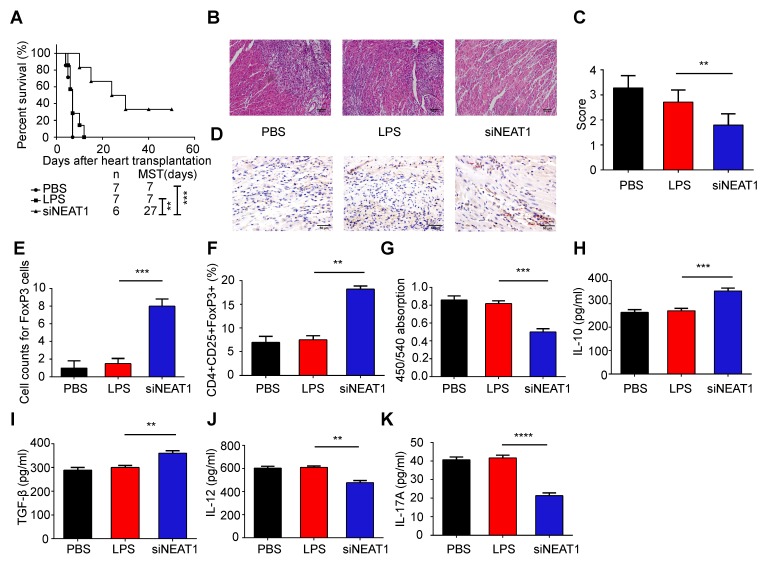
Knockdown of NEAT1 DCs induce immune tolerance in a model of heart transplantation. (A) Graft survival times of Balb/c mice transfused with PBS, LPS-DCs, or siNEAT1 DCs. MST, median survival time. Survival of cardiac allografts in groups of mice was compared using the Mann-Whitney U test. (B-C) Histologic studies of harvested cardiac allografts stained with hematoxylin and eosin 14 days after transplantation (B). Hematoxylin and eosin staining was graded according to the 2005 classification of International Society for Heart and Lung Transplantation for acute cellular rejection (C). Scale bars correspond to 100 µm.Data are expressed as mean ± SD; n = 6 biological replicates; **p<0.01, derived using Student's t-test. (D-E) Infiltration of FoxP3 cells into cardiac grafts of mice injected with PBS, LPS-DCs, or siNEAT1 DCs 14 days after grafting (D). Cell counts of infiltrating FoxP3 cells in cardiac allografts from each group (E). Scale bars correspond to 50 µm. Data are expressed as mean ± SD; n = 6 biological replicates; ***p<0.001, derived using Student's t-test. (F) Expression of CD4+CD25+FoxP3+Treg in splenocytes was assessed by flow cytometry in three different groups. Data are expressed as mean ± SD; n = 6 biological replicates; **p<0.01, derived using Student's t-test. (G) The proliferation of T cells in different groups was assessed using MLR by BrdU ELISA. The stimulator cells were C57BL/6 splenocytes treated with mitomycin C. Data are expressed as mean ± SD; n = 6 biological replicates; ***p<0.001, derived using Student's t-test. (H-K) The levels of cytokines (IL-10, TGF-β, IL-12, and IL-17A) were detected by ELISA in the plasma of recipient mice 14 days after heart transplantation. Data are expressed as mean ± SD; n = 6 biological replicates; **p<0.01, ***p<0.001, ****p<0.0001, derived using Student's t-test.

