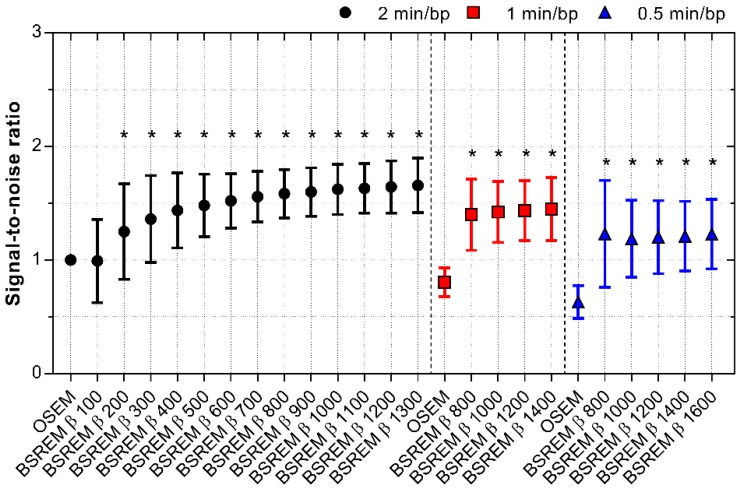
Figure 6.
SNR for OSEM and BSREM image reconstructions, including TOF and PSF recovery, using various parameter settings, and data acquisition of 2, 1 and 0.5 min per bed position. The data were normalized to OSEM (3 iterations/16 subsets, 5 mm gaussian postprocessing filter, 2 min per bed position) and asterisk indicates significantly higher SNR (p < 0.05) compared to the reference OSEM. The markers show mean ± SD. BSREM: block-sequential regularized expectation maximization; OSEM: ordered subsets expectation maximization.

