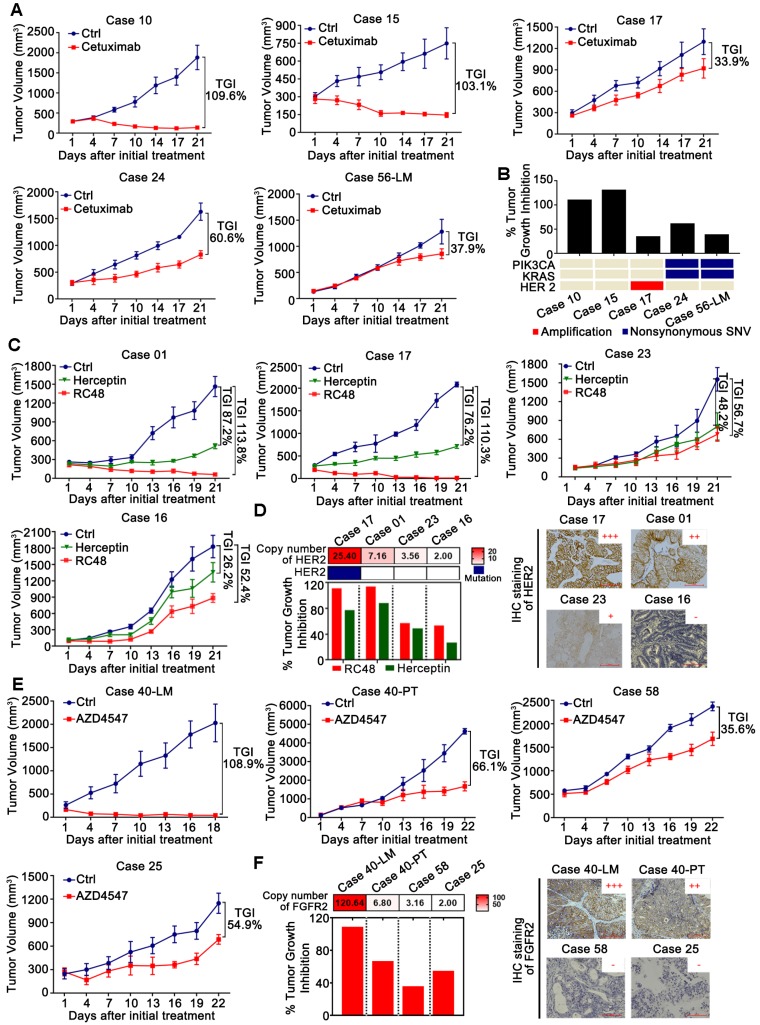
Figure 5.
Validation of targets and discovery of novel drugs in CRLM PDX models for preclinical studies. (A1) The efficacy of anti-EGFR monoclonal antibodies Cetuximab on five PDX models (N=5/group). (B) Comparison of the efficacy of Cetuximab among five PDX models with genetic alterations of KRAS, PIK3CA and HER2. PDX models with KRAS mutations, PIK3CA mutations or HER2 amplification showed primary resistance to Cetuximab, which agreed with the findings of large retrospective and prospective trials. (C) The efficacy of RC48 and Herceptin on four PDX models (N=5/group). (D) Representative examples of xenograft tumors with HER2 copy number variations and expression, assessed by NGS (Left) and IHC (Right). RC48 and Herceptin exhibited stronger tumor suppressive activity in PDX models with HER2 amplification than those with HER2 un-amplification. (E) The efficacy of AZD4547 in four PDX models (N=5/group). (F) Representative examples of xenograft tumors with FGFR2 copy number variations and expression, as assessed by NGS (Left) and IHC (Right). AZD4547 exhibited selective antitumor activity in the PDX models with FGFR2 amplification and high expression. The antitumor activity was depicted by %TGI. TGI = (1-ΔT/ΔC) × 100%, (ΔT = Tumor volume change of the drug-treated group, ΔC = Tumor volume change in the control group on the final day of the study). Tumor volumes and proportion of tumor growth inhibition were expressed as means ± SD. Positive staining of IHC was counted from five randomly selected areas in each slide at × 400 magnification. Scale bars = 100 μm.

