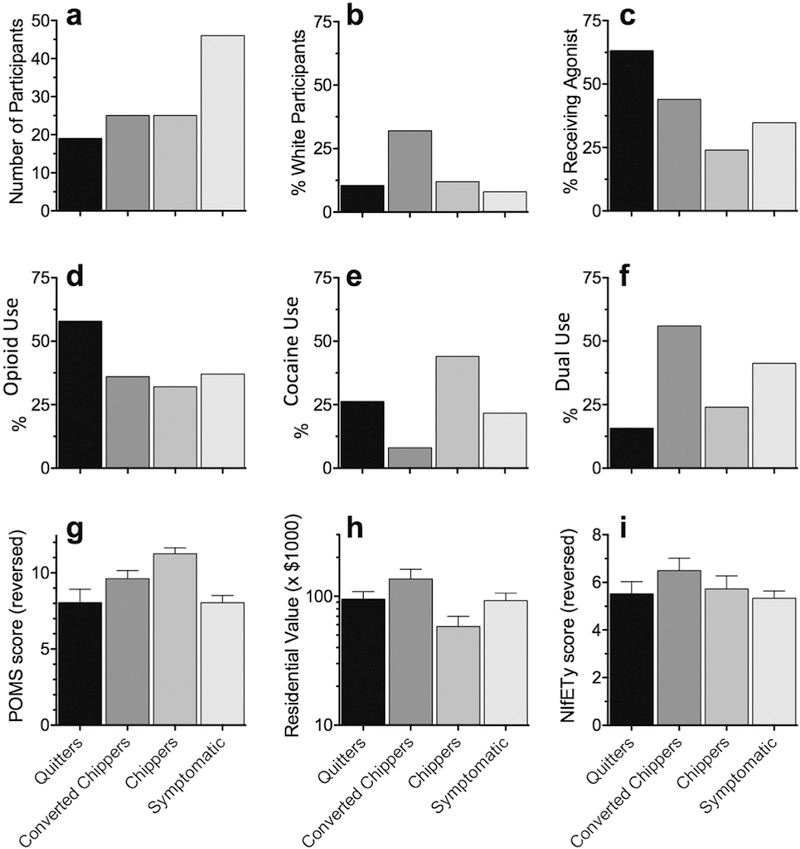
Figure 3.
Summary values of variables included in the multinomial logistic regression model, showing percentage in each cluster (including the “cluster” of Quitters, defined prior to clustering). (a) number of participants in each cluster; (b) percentage of participants self-described as being white; (c) percentage of participants who initiated opioid agonist therapy between the baseline and 12-month visits;* (d, e, f) percentage of participants who enrolled in the study with use of opioids, cocaine, or both, respectively; (g) summary rating on the Profile of Mood States (POMS) questionnaire, referring to the 30-day period prior to joining the study, with higher values indicating a “better” state; (h) average value of residences in the participant’s home neighborhood; and (i) Neighborhood Inventory for Environmental Typology (NIfETy) ratings, with higher values indicating a more orderly neighborhood environment.
*77.3% of the overall sample expressed interest in treatment at Visit 1, 87% of Symptomatic, 78.9% of Quitters, 92% of Converted Chippers and 44% of Chippers.

