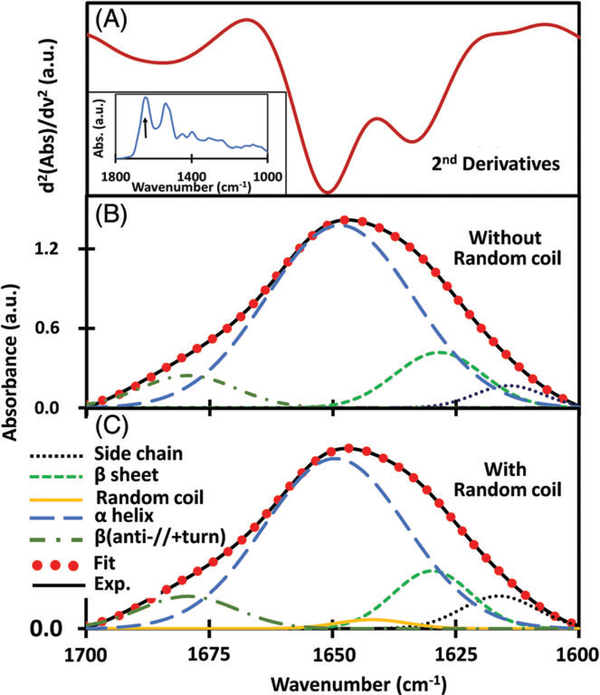
FIGURE 2.
(A) Second derivative of ATR-FTIR absorbance of control sera showing the deconvolved amide I region. Inset shows the spectra in the 1800 to 1000 cm−1 region with the arrow indicating the amide I region. (B) The individual secondary structure components were modeled using Gaussian oscillators whose positions were determined from the second derivative of the absorbance to obtain simulated fits to the experimental curves. (C) Secondary structures with the inclusion of random coil components approximately at a position of 1641 cm−1

