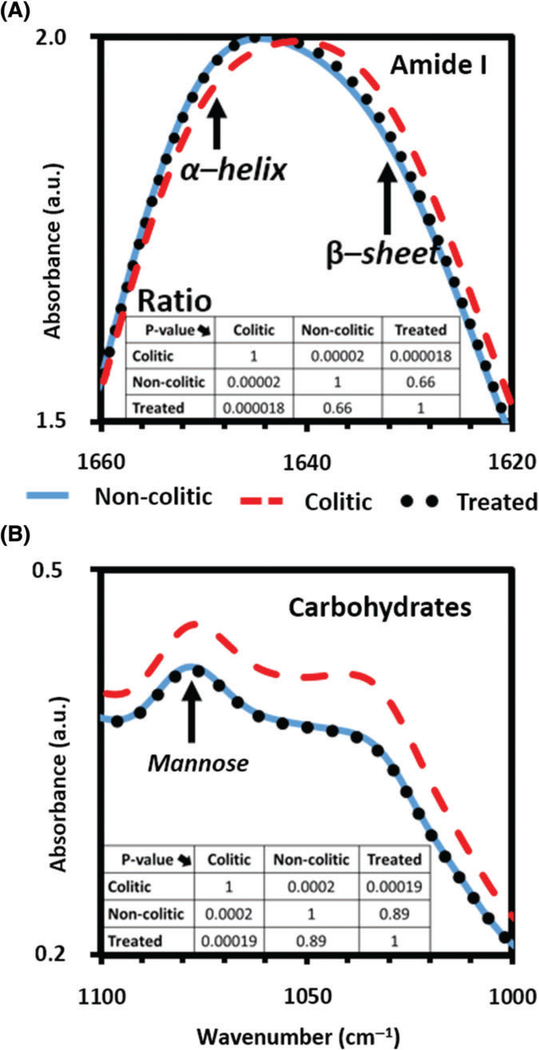
FIGURE 5.
Absorbance spectra of the colitic (---), non-colitic (—) and anti-TNFα treated (…) sera in the (A) amide I region, including α-helix/β-sheet and (B) carbohydrates region including mannose. In both colitis screening spectral signature regions, colitic data are significantly different (P < .0002) from noncolitic and anti-TNFα treated data. Simultaneously when comparing noncolitic and anti-TNFα treated, the P values are much >.6 indicating that the 2 groups are very similar

