
Fig. 4.
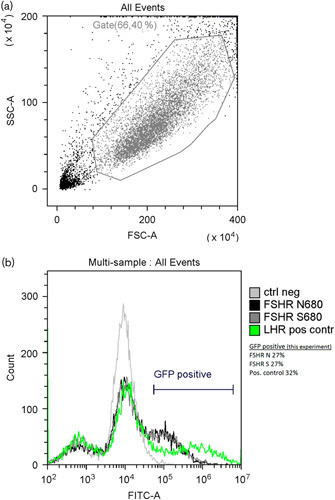
(a) Representative sample of gating of cells during FACS analysis. SSC-A side scatter, FSC-A forward scatter. (b) Representative histogram of analysed cells from one experiment, fluorescent intensity (FITC-A) versus number of events (count). Light grey line – negative control cells (background), black line – FSHR asparagine variant, dark grey line – FSHR serine variant, green line – positive control. The green fluorescent protein-positive bar indicates the cells with a fluorescence above background; the percentage of positive cells for the experiment is indicated. FSHR, follicle-stimulating hormone receptor.