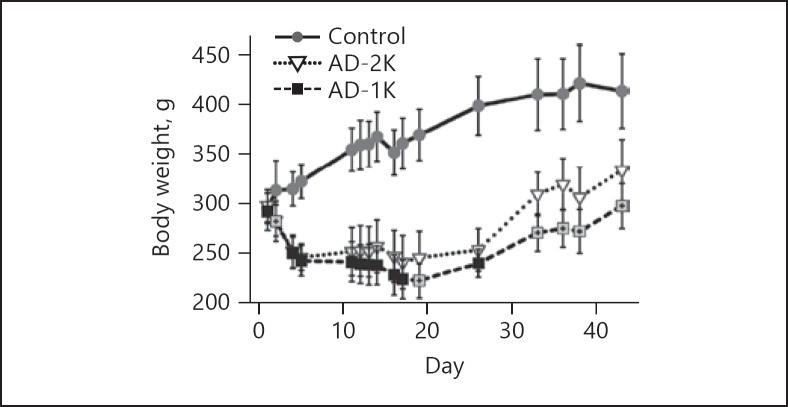
Fig. 3.
Body weights longitudinally assessed in the rats. The graphic illustrates arithmetic mean values and standard deviations on each of the specified study days. AD-1K values are plotted as black or crossed grey squares. Crossed grey squares refer to a significant difference of AD-1K versus AD-2K rats (p < 0.05, change from baseline). AD-1K rats, rats with unilateral nephrectomy, adenine at 0.75% in the diet; AD-2K rats, sham-operated rats, adenine at 0.75% in the diet.

