Fig. 2.
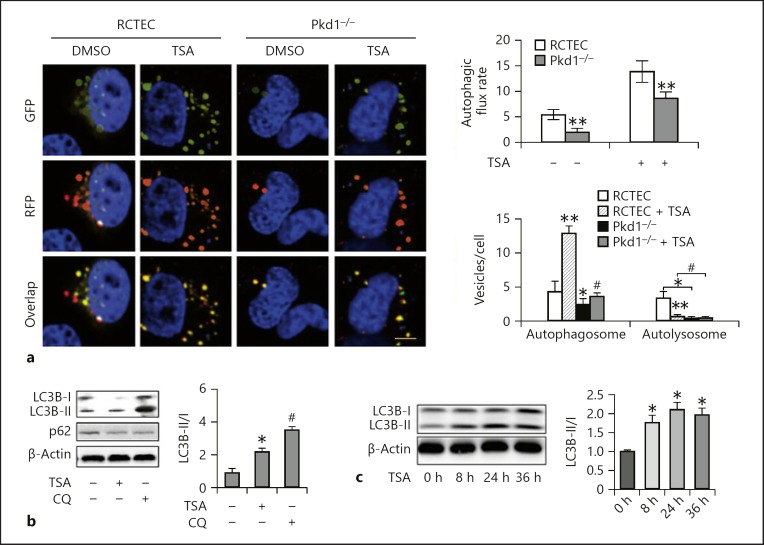
TSA enhances autophagy in Pkd1 mutant renal epithelial cells. a Representative images showing GFP-LC3 and mRFP-LC3 puncta in transfected cells. Yellow puncta indicate autophagosomes and red dots indicate autolysosomes. Left: representative images. Scale bar, 100 μm. Right: analysis of autophagic flux rate and quantitative analysis of autophagosomes and autolysosomes per cell. Data are expressed as mean ± SD. * p < 0.05, ** p < 0.01 vs. control group; # p < 0.05 vs. group without TSA. b Pkd1−/− cells were treated or untreated with TSA (0.1 μM) in the absence or presence of 20 μM CQ. The cells were then collected for immunoblot analysis of LC3B and p62. β-Actin was used as a loading control. Left: representative immunoblots. Right: densitometric analysis of LC3B signals. Data are expressed as mean ± SD. * p < 0.05 vs. control group; # p < 0.05 vs. group without CQ. c Pkd1−/− cells were treated with 0.1 μM TSA for 8, 24, or 36 h. After treatment, whole-cell lysates were collected for immunoblot analysis of LC3B. Left: representative immunoblots. Right: densitometric analysis of LC3B signals. After normalization with LC3B-I, the protein signal of the control was arbitrarily set as 1, and the signals of the other conditions were normalized with the control to calculate fold changes. Data are expressed as mean ± SD. * p < 0.05 vs. control group. TSA, trichostatin A; RCTEC, renal cortical tubular epithelial cell; CQ, chloroquine.

