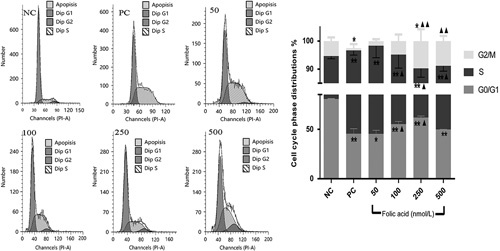
Fig. 2.

Cell cycle phase distributions and analysis after cells were pretreated with 50, 100, 250, and 500 nmol/l folic acid and exposed to 32 μmol/l benzo(a)pyrene (BaP) for 24 h. Cell cycle profiles were analyzed by flow cytometry. Bars represent the percentages of cells in the G0/G1, S, and G2/M phases, respectively. Data represent the mean±standard error values of three independent experiments. Compared with the positive control group, ▲P<0.05 and ▲▲P<0.01, Compared with the negative control group, *P<0.05 and **P<0.01.
