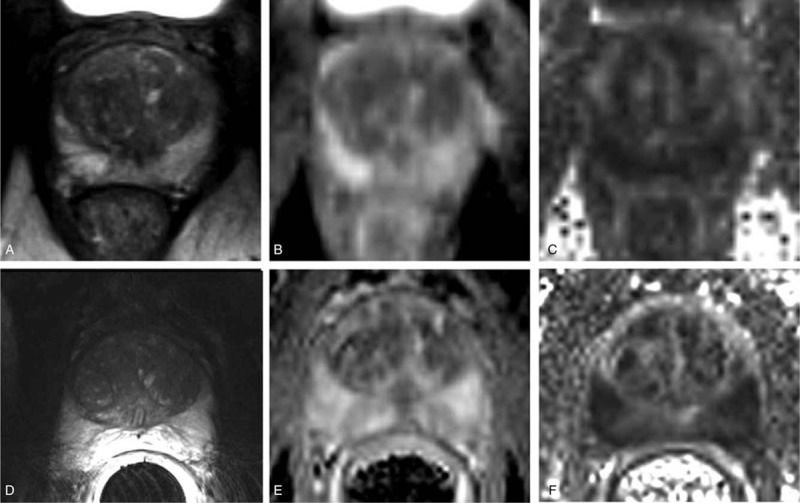
FIGURE 8.

T2-weighted anatomical images (A,D), apparent diffusion coefficient (ADC) (B,E), and fractional anisotropy (FA) maps (C,F) of the prostate. Images in the top row (A–C) and bottom row (D–F) were acquired using 16LD alone and in combination with a 2-channel ERC, respectively. Republished with permission of John Wiley and Sons from “Development and evaluation of a multichannel endorectal RF coil for prostate MRI at 7T in combination with an external surface array,” Erturk MA, Tian J, Van de Moortele PF, et al. JMRI. 2016;43(6); permission conveyed through Copyright Clearance Center, Inc.
