Figure 4.
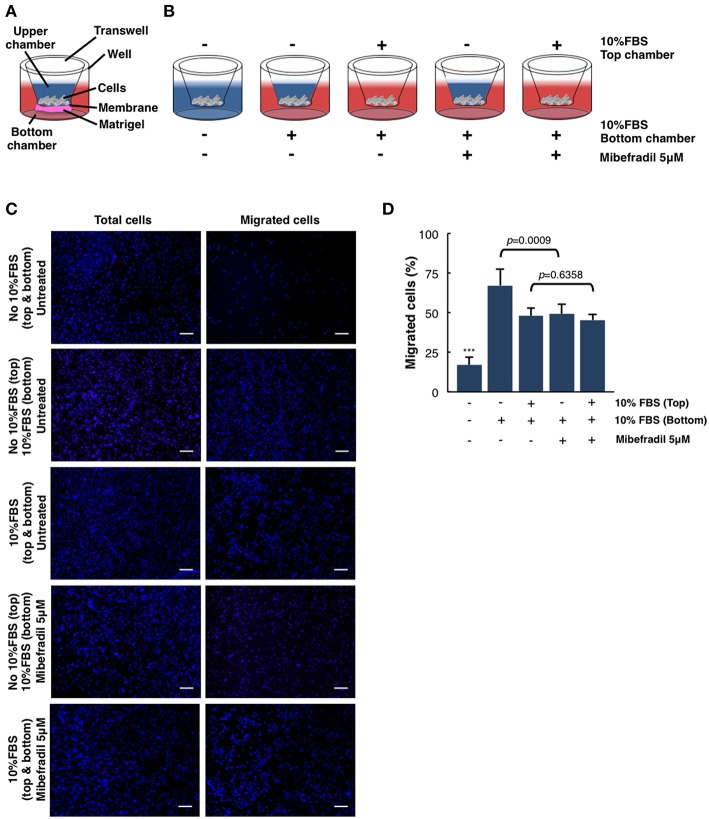
Quantitative and qualitative analysis of melanoma cell migration assessed by in vitro transwell assay. (A) Schematic illustration of the different parts of transwell system. (B) Experimental design scheme of transwell migration assay. Cells were seeded on the upper side of the transwell membrane. In the upper and/or lower compartment, 10% FBS was added as a chemoattractant (red color). When stated, Mibefradil (5 μM) was added in lower compartment. (C) Representative fluorescent images of nuclear Hoechst staining (10 μg ml−1) were captured at 20 h after treatment indicated total cells (left panel) and migrated cells (right panel). Scale bars, 100 μm. (D) Percentage of migrated cells after 20 h, with or without treatment and (–) or (+) chemoattractant (10% FBS). Cells were counted from 10 random microscope fields for each sample in 3 independent experiments. Values are means ± SD. The corresponding p-values (*** = p < 0.0001) were obtained by one-way ANOVA followed by Tukey-Kramer post-hoc test.

