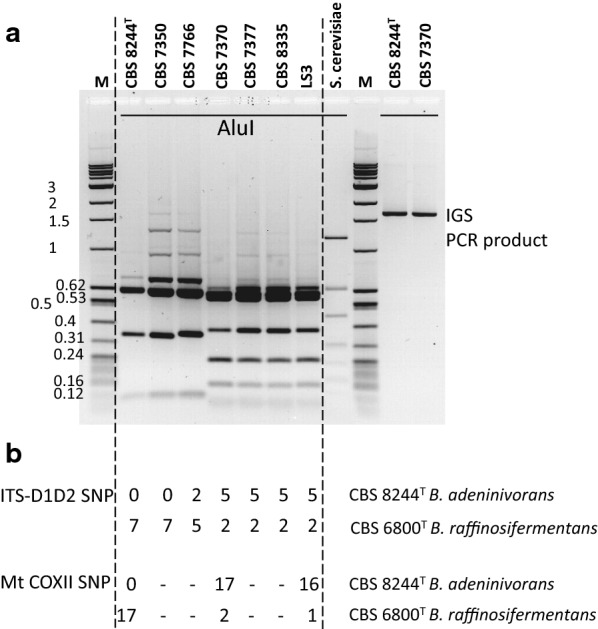
Fig. 2.

Two genotypic groups in strains previously identified as B. adeninivorans and relation with B. raffinosifermentans. a IGS profiles. The right part of the agarose gel shows an example of the PCR product obtained for two strains. The left part shows AluI restriction profiles for the seven strains. Saccharomyces cerevisiae ATCC 42367 was used as a control. The M wells are occupied by the molecular weight standard, a mixture of NEB quick-load 1 kb ladder and pBR322 MspI-digest, for which the size of some bands is indicated in kb. b Single-nucleotide polymorphisms (SNPs) in the ITS-D1D2 (1086 nt) and mitochondrial COXII (598 nt) sequences. The number of SNPs (including one indel in ITS) is indicated for these markers for each comparison between the strain above and the type strains to the right. (–) indicates not determined
