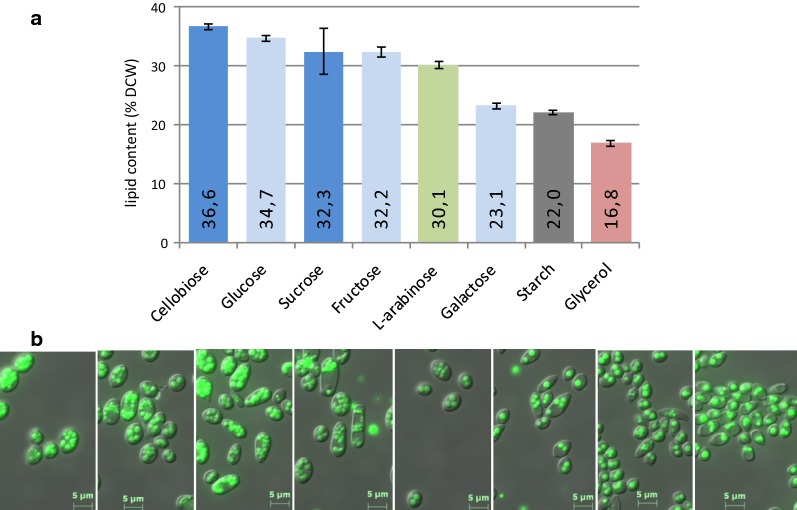
Fig. 5.
Bioconversion of various sugars into lipids. LS3 was cultivated for 72 h in nitrogen-limited YNB-based medium (0.75 g/L NH4Cl) supplemented with the indicated sugars at 30 g/L. a Lipid content (% DCW) is presented as a bar with the average value and mean deviation (n = 2) and a color code indicating the nature of the carbon source: green, C5 monosaccharide; light blue, C6 monosaccharide; blue, disaccharide; gray, polysaccharide; red, polyol. b Microscopic images after BODIPY® staining of the 72 h-cultivated cells in the relevant medium (same order as in the histograms)

