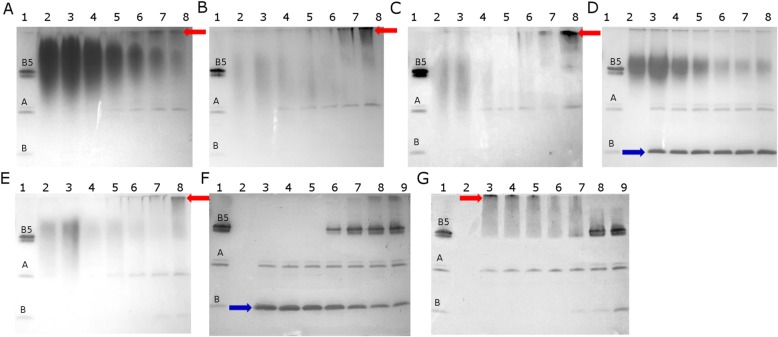
Fig. 7.
SDS PAGE analysis of the interaction between cholera toxin and plant extracts. a agrimony, b blackberry leaf, c raspberry leaf, d rosehip, e wild strawberry leaf, f gallic acid control and g GM1 control. For all panels, lane 1 contains 2 μg CTX (dissociated into: B5–57 kDa, A – 28 kDa and monomer B – 11.4 kDa), lane 2–1 mg of plant extracts or 0.1 mg gallic acid or 2 μg GM1. For panels (A-E), lanes 3–8 contain 2 μg CTX and: 1.0, 0.5, 0.25, 0.125, 0.06, 0.03 or 0.0015 mg plant extract. For panel F, lanes 3–8 contain 2 μg CTX and: 0.1, 0.05, 0.025, 0.0125, 0.006, 0.003 or 0.0015 mg gallic acid. For panel G, lanes 3–8 contain 2 μg CTX and: 2.0, 1.0, 0.5, 0.25, 0.125, 0.06, 0.03 μg GM1. The red arrow indicates aggregated protein, the blue arrow shows increased amount of monomer B. The reaction volume was 12 μl for all samples

